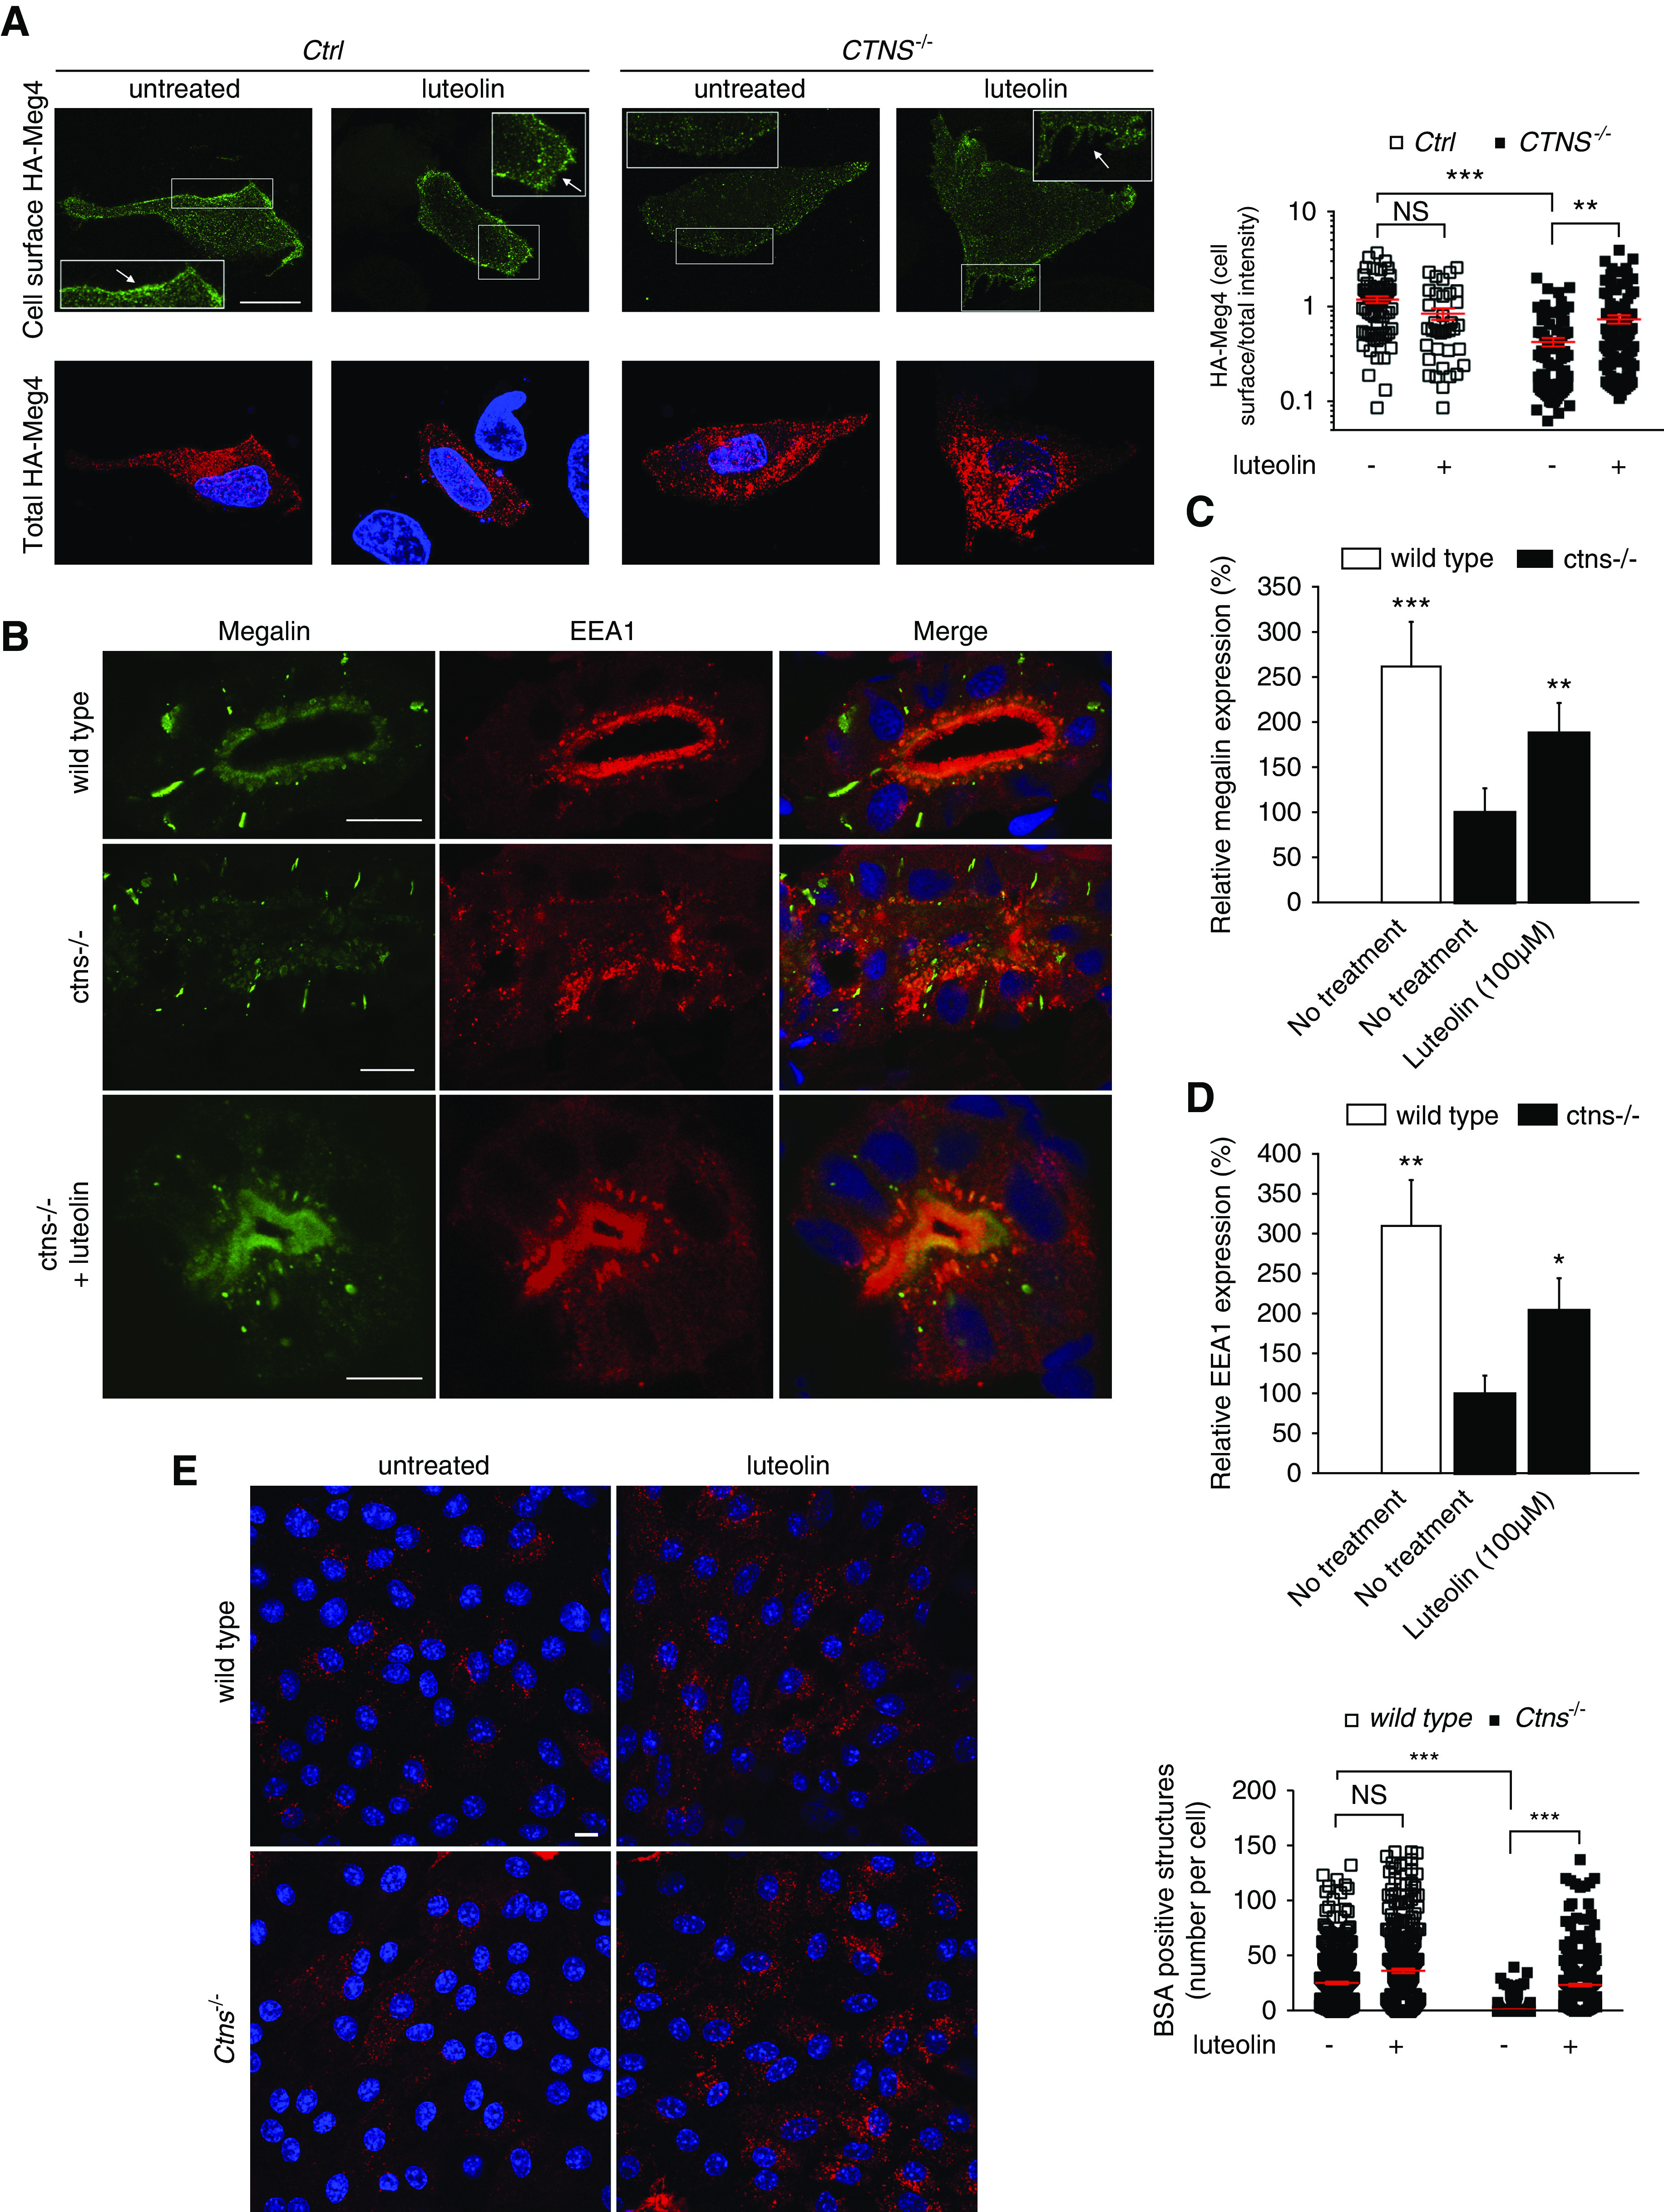
Figure 8.

Luteolin restores endocytic defects in cystinosis. (A) Ctrl and CTNS−/− ciPTCs were transiently transfected with HA-Meg4. After 4–6 hours, transfection medium was replaced by full medium or 50 μM luteolin for 24 hours. The cell surface exposure of HA–Meg4 was measured through binding at 4°C (cell surface HA–Meg4) of an anti-HA mouse antibody. The total amount of HA–Meg4 expressed was measured using an anti-HA rabbit antibody (total HA–Meg4) in permeabilized HA–Meg4 cells. The arrows indicate plasma membrane localization of HA-Meg4. Scale bar is 20 μm. Histogram shows ratios of cell surface/total HA-Meg4 fluorescence intensity (n>65 cells for each experimental condition). t test **P<0.01; ***P<0.001 and NS not statistically significant . (B) Representative confocal images of the protein expression of the multiligand receptor megalin (green) and EEA1 (red) in wild-type larvae, untreated ctns−/− larvae, and luteolin-treated (100 µM) ctns−/− larvae. Scale bar is 5 µm in all images. Quantitation of periluminal fluorescence intensity at the level of the proximal tubules of (C) megalin (n=8 larvae/group) and (D) EEA1 (n=4 larvae/group). Relative fluorescence intensities in quantitation graphs were referred to the untreated ctns−/− group, which was considered as 100%. t test *P<0.05; **P<0.01; and ***P<0.001. (E) Representative images of BSA uptake (red) in wild-type and Ctns−/− mPTCs under basal condition or treatment with 50 µM luteolin for 24 hours. Scale bar is 10 µm. Number of BSA-positive structures per cell was quantified; mean and SEM are shown in red (n>300 cells, one-way ANOVA followed by Bonferroni post hoc test, ***P<0.001 and NS not statistically significant).
