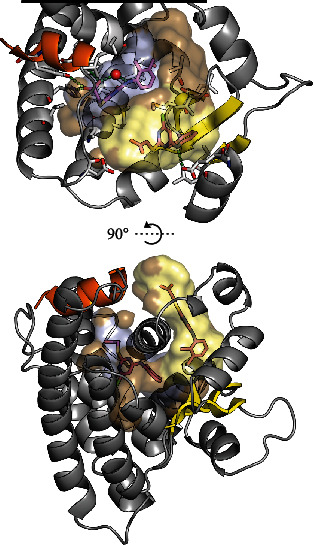
Figure 4.

PPARα in complex with two molecules of WY14643 (shown with magenta carbons) taken from PDB ID: 4BCR [119]. H12 is shown in orange, and β1-β4 are shown in yellow. To illustrate ligand-pocket interactions, the inner surface of the binding pocket is shown in brown with surface areas ≤ 3.7 Å from the ligand binding primarily in the AF-2 pocket highlighted in light blue. Similarly, the contact surfaces of the ligand binding in the Ω pocket and under the Ω loop are shown in pale yellow. Top: residues ≤ 5.0 Å from the ligands are shown with grey carbons. Plausible hydrogen bonds are indicated with green dashes. The side chain oxygen of Ser280 is shown as a red sphere at 50% of its van der Waals radius. For clarity, the Ω loop and the N-terminal half of H3 (residues 252-284) are hidden. Also, the visualization of the LBD has been truncated (black line) in order to maximize the visibility of the LBP. Bottom: a perpendicular view to the LBP illustrating the distance between the WY14643 binding sites. The Ω loop is shown in a cartoon representation with two notable helical segments, indicating its stabilization by the binding of the second molecule of WY14643 [119]. The LBP surfaces were mapped with a 1.4 Å probe using HOLLOW [102], and the resulting population of probes was truncated at the solvent interface of the Ω pocket. The structures and surfaces were visualized in PyMOL (ver. 1.8.4.0) [13, 14].
