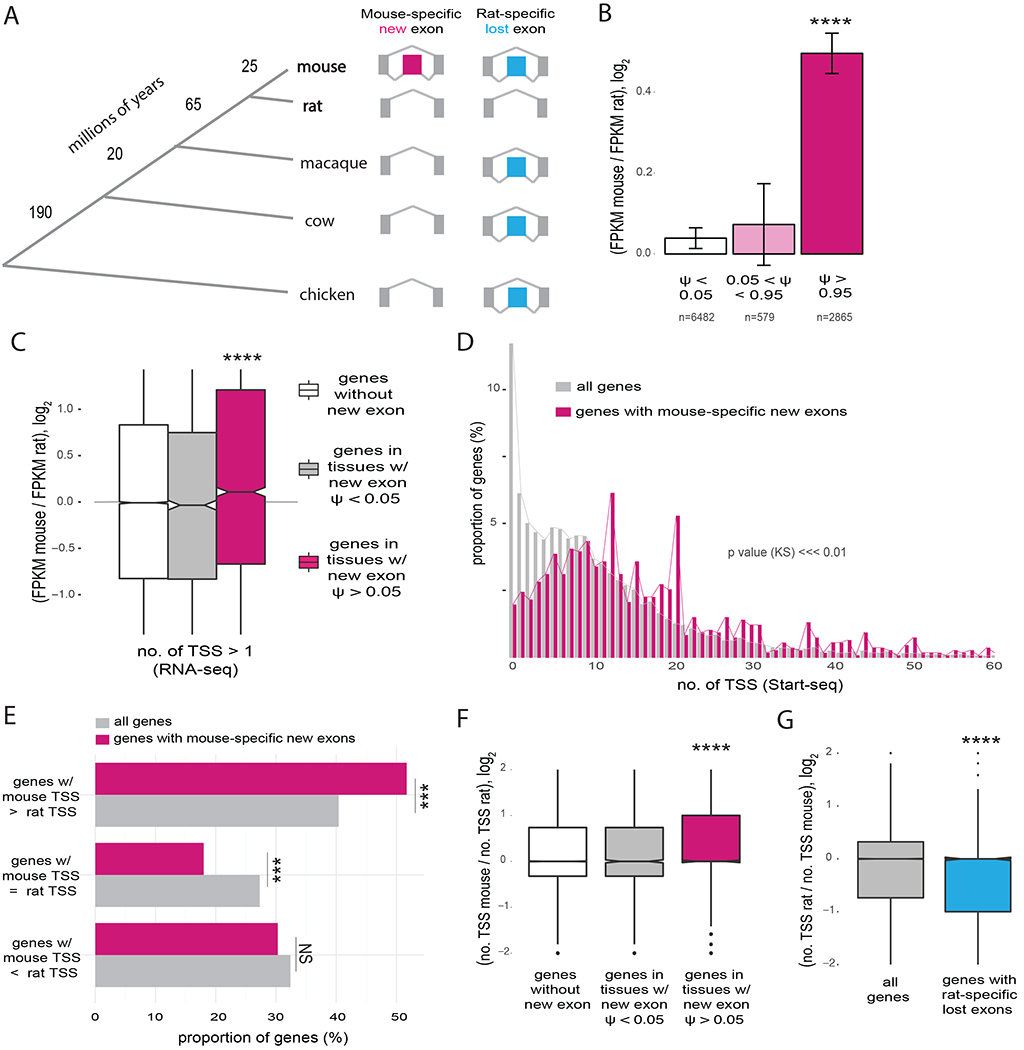
Figure 1. Splicing of new exons is associated with increased gene expression and gain of TSSs.

A, Phylogenetic tree representing the main species used for dating evolutionarily new exons and approximate branch lengths in millions of years. The patterns of inclusion/exclusion used to infer mouse-specific new exons (n = 1089) and rat-specific lost exons (n = 515) are shown. B, Fold change in gene expression in genes with mouse-specific exons (assessed by fragments per kilobase of exon per million mapped reads, FPKM) between mouse and rat in 9 organs, binned by ψ value of the new exon in each tissue. Number of gene-tissue pairs in each category is indicated. Mean ± SEM of displayed distributions is shown. C, Fold change in gene expression between corresponding tissues of mouse and rat in genes with multiple TSSs in mouse (no. of TSS > 1) for mouse control genes with no new exons (white), genes with mouse-specific new exons in tissues where inclusion of the new exon is not detected, PSI < 0.05 (grey), and genes with new mouse-specific exons in tissues were the exon is included, PSI > 0.05 (pink). D, Distribution of the number of TSSs per gene using Start-seq data from murine macrophages for all genes expressed in mouse and genes with mouse-specific new exons. TSS peaks located within 50 bp from each other were merged. Genes with mouse-specific new exons have increased numbers of TSSs (p < 2.2e−16 by Kolmogorov-Smirnov test). E, Proportion of genes that gained TSSs in mouse (mouse TSS > rat TSS), genes that lost TSSs in mouse (mouse TSS < rat TSS) and genes with same number of TSSs in both species (mouse TSS = rat TSS) for all genes expressed in both species and genes with mouse-specific new exons. F, Fold change in the number of TSSs used per gene between mouse and rat for 9 tissues, for mouse genes grouped as in (C). G, Ratio of number of TSSs used in rat over number used in mouse, for all genes expressed in both species (grey) and for genes with rat-specific lost exons (blue).
See also Figure S1.
