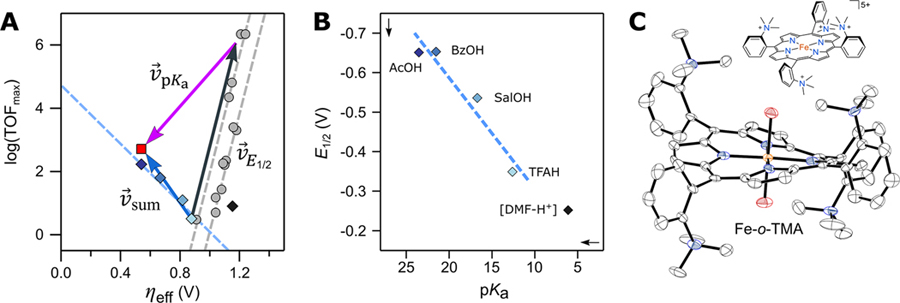
Figure 7.
(A) Plot of log(TOFmax) vs ηeff for catalytic systems of Fe-o-TMA and varying buffers (blue diamonds match buffers in part B). Superimposed vectors show predicted changes from ΔpKa (purple), ΔE1/2 (black), and summative effects (blue). The predicted/observed values for acetic acid buffer are the red square/dark-blue diamond. Prior Fe(por) data and ΔE1/2 scaling relationships included for reference (gray). (B) Plot of E1/2 vs acid pKa at 0.1 M buffer. (C) Drawing of Fe-o-TMA and the solid-state X-ray crystal structure of [Fe-o-TMA·2H2O]OTf5 (H atoms and triflates omitted, thermal ellipsoids at 50% probability). Figures adapted with permission from ref 35. Copyright 2020 American Association for the Advancement of Science.

