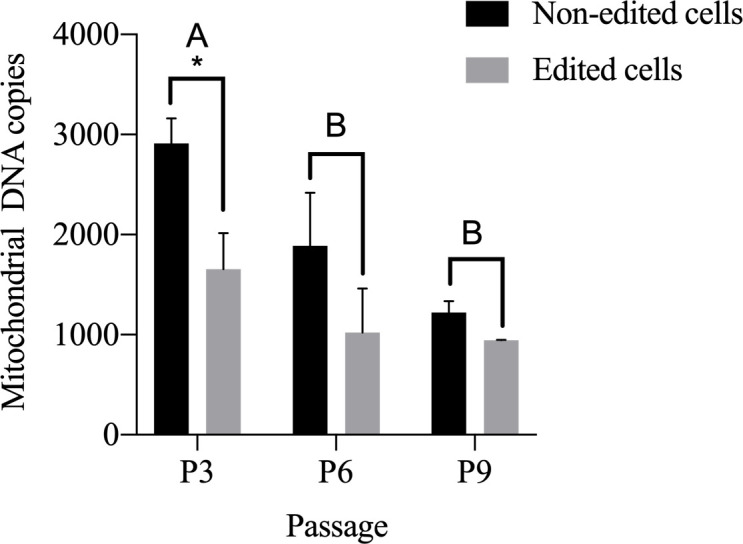
Fig 3. mtDNA copies per cell in different cell passages.

Non-edited cells (control) and edited cells. Note non-edited cells in passage 3 with 2.912 copies and edited cells with 1.655 mitochondrial DNA copies; in passage 6 note non-edited cells with 1.889 copies and edited cells with 1.020 copies. In passage 9 observe a greater decline. Note non-edited cells with 1.222 copies and edited cells with 945 copies. A-B Different capital letters indicate significant differences between the passages, regardless of the gene edition (p <0.05). * Differences between gene edition within the passage (p <0.05).
