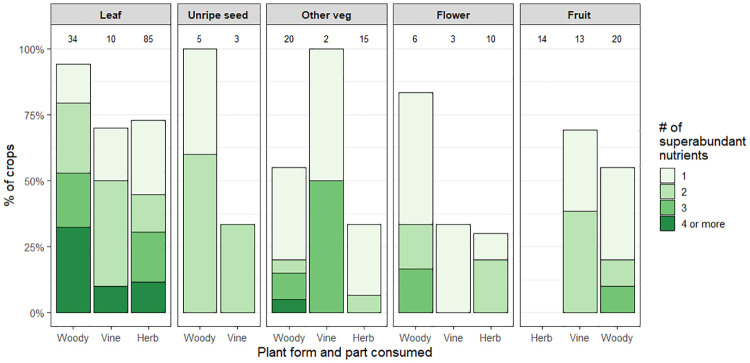
Fig 4. Proportions of perennial vegetables with one or more superabundant nutrients by plant form and part consumed.
Nutrient levels are classified as superabundant when they are higher than the highest level of that nutrient among the reference vegetables. Here the percentage of crops with one or more superabundant nutrients is displayed for 240 perennial vegetables broken down by plant form and part used. The numbers of crops within each category are displayed along the top of the plot.

