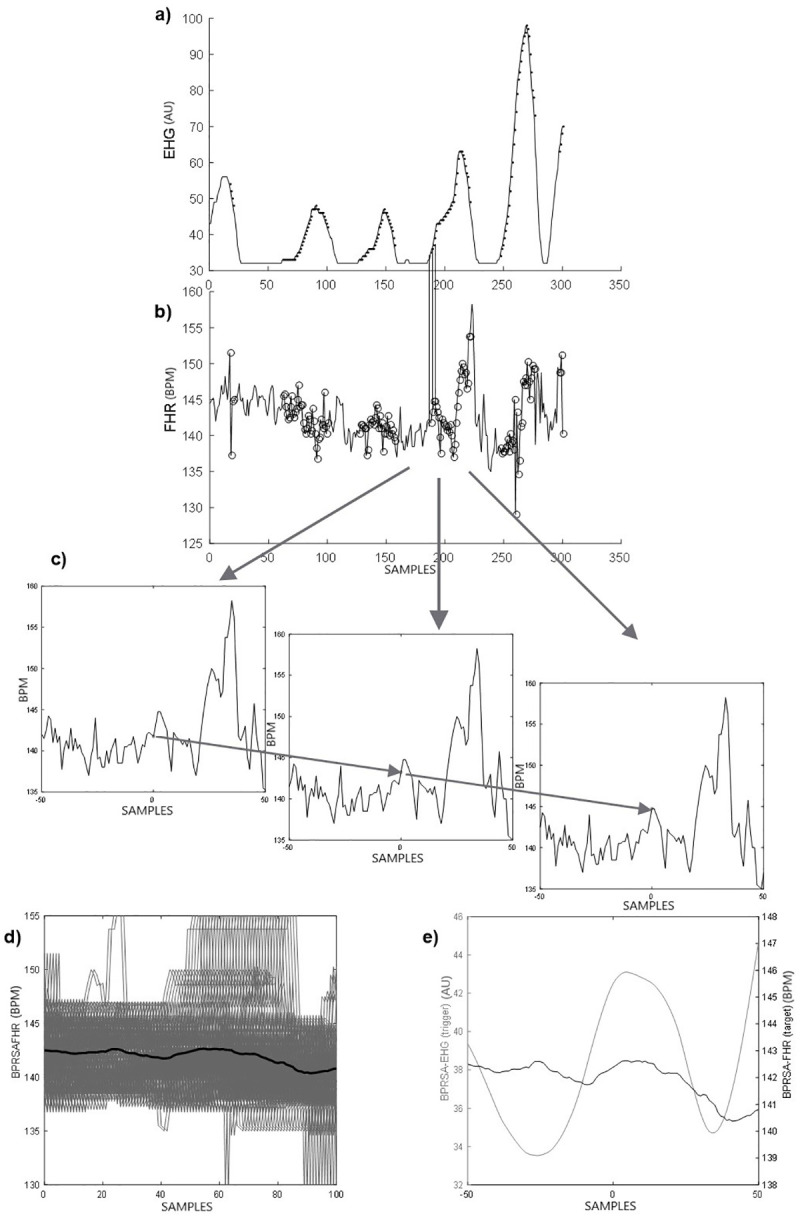
Fig 1.

Description of the Bivariate Phase-rectified Signal Averaging (BPRSA) method: a) Raw uterine activity or electrohysterogram EHG (trigger signal): each data point depicted is the average of the raw signal obtained every 2 s. Each black dot represents an anchor point (EHG increases according to Eq 1). b) Raw fetal heart rate or FHR (target signal). The circles represent corresponding anchor points derived from the EHG signal; c) segments of fetal heart rate, centered around the anchor point (using time windows of 200 s, each data point (i) is the average of the FHR obtained every 2 s); d) Phase rectification at the anchor points and signal averaging; e) final BPRSA graph representing the BPRSA transformation of EHG and FHR.
