
Figure 6.
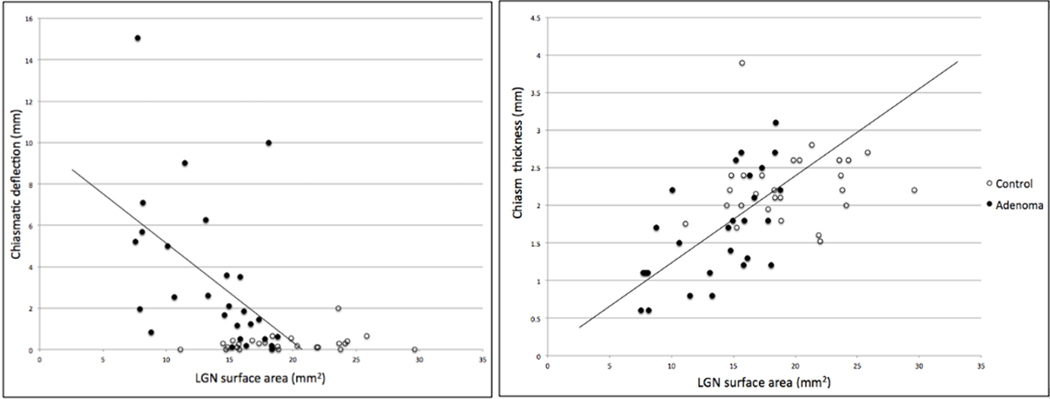
Correlations between LGN cross-sectional area and optic chiasm morphometry in controls and adenoma patients. Correlation (r = −0.52, P < 0.0001) between LGN cross-sectional area and chiasmatic deflection (left). Correlation (r = 0.54, P < 0.0001) between LGN cross-sectional area and chiasm thickness.