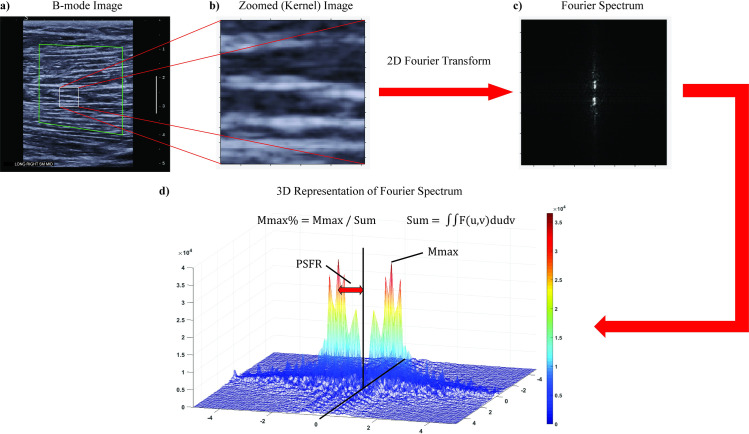
Fig 1. SFA procedure.
a) Representative B-mode image of the mid-belly of the semimembranosus with ROI and kernel. The larger green polygon is a representation of the segmented parent ROI. The ROI was drawn in the central portion of the muscle by identifying the superficial and deep (when visible) aponeuroses being careful to avoid boundary effects of the aponeuroses and lateral edges of the image. The smaller white square is an example of a kernel in which the 2D Fourier Transform was performed. b) Zoomed in image of kernel within B-mode image. c) 2D Fourier spectrum of kernel. d) 3D representation of Fourier spectrum with SFA parameters visualized.

