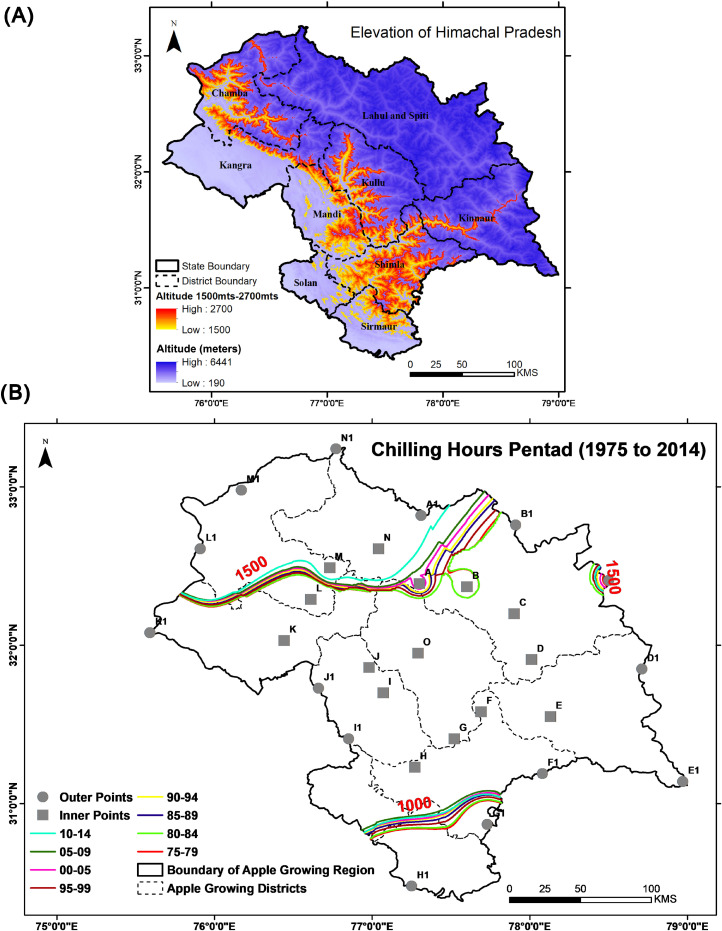
Fig 2.
Panel (A) Elevation of Himachal Pradesh shown using Cartosat-DEM and as per the standards, the altitude suitable for apple cultivation is highlighted in shades of red colour; Panel (B) Shifting of the chilling hours from the period 1975–1979 to 2010–2014. Grey colour filled circles and squares show the points considered to extract temperature value for calculating chilling hours. Lines with different colours represent the optimum chilling hours for a particular period as given in the legend.

