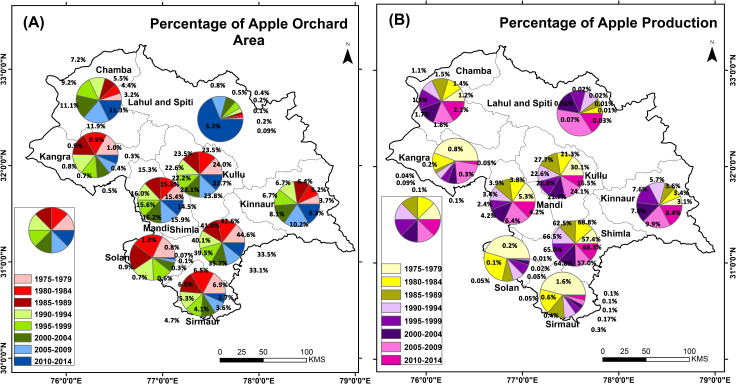
Fig 8.
Panel (A) District wise percentage of area covered under apple orchard in Himachal Pradesh. Panel (B) District wise percentage of apple production in Himachal Pradesh. The percentage is given in panel (A) and panel (B) is in respect of the total area of an apple orchard in Himachal Pradesh and total production of apple in Himachal Pradesh respectively. Here, the pie chart’s covered area is for periodic visual comparison at district level.

