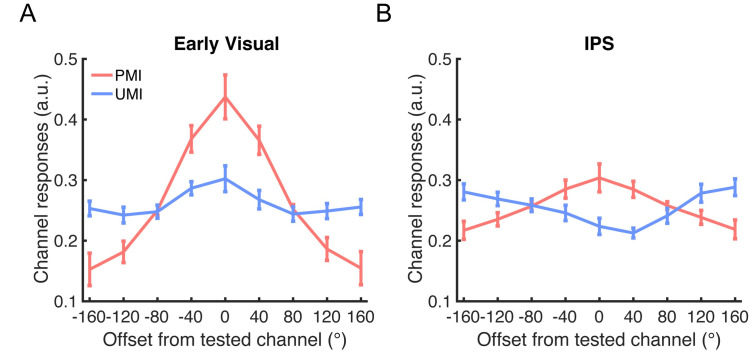
Fig 5. IEM reconstructions of stimulus location in Delay1.2.
(A) IEM reconstructions of stimulus location during late Delay1.2 (18 s after trial onset) in early visual ROI. (B) IEM reconstructions of stimulus location during late Delay1.2 in IPS ROI. All results were from PMI-trained IEMs. Red lines represent the PMI, and blue lines represent the UMI. All error bars indicate ± 1 SEM. Data are available at osf.io/G4C3N. a.u., arbitrary unit; IEM, inverted encoding model; IPS, intraparietal sulcus; PMI, prioritized memory item; ROI, region of interest; UMI, unprioritized memory item.

