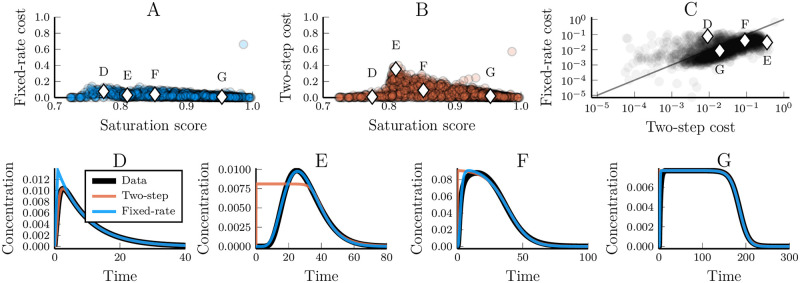
Fig 10. The descriptive power of simplified non-linear kinase cascade models depends on the saturation level of the approximated system.
(A and B) The fixed-rate and two-step assumptions respective dependency on the saturation level of the data it tries to emulate. The saturation is measured by a quantity that depends on the shape of the final peak (Methods). Linear systems receive a saturation score of between 0.7 (for one-step systems) to 0.83. A score of 1 means that the peak is completely square. Circles represent a single data/model pair and diamonds highlight example curves in (D-G). (C) Comparing the cost values of the data-fits for models using the fixed-rate or two-step assumption.

