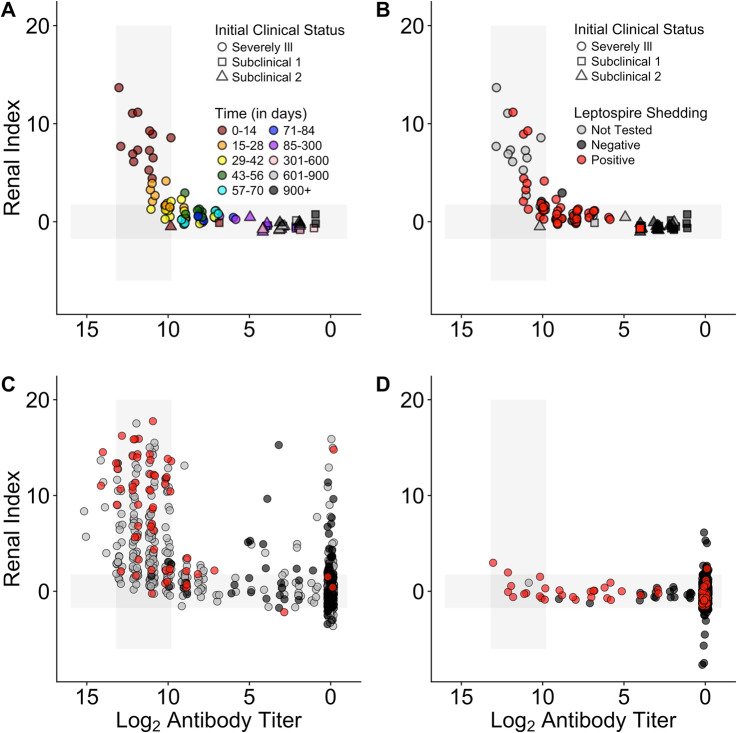
Fig 4. Map of host-pathogen space.
Maps of the host-pathogen space created by plotting jittered log2 anti-Leptospira antibody titers (x-axis) against renal index values (y-axis). Plots created using data from the longitudinally followed animals (CLINICAL and SUBCLINICAL), color-coded by time since admission to a rehabilitation center (A) and by urinary leptospire shedding status (B). Plots created using cross-sectional data from stranded animals (STRAND; C) and wild-caught, free-ranging animals (WILD; D) color-coded by urinary leptospire shedding status. In all panels, horizontal grey bands are equivalent to those in Fig 1C & 1D, and the vertical grey bands are equivalent to the horizontal bands described in Fig 1A & 1B.

