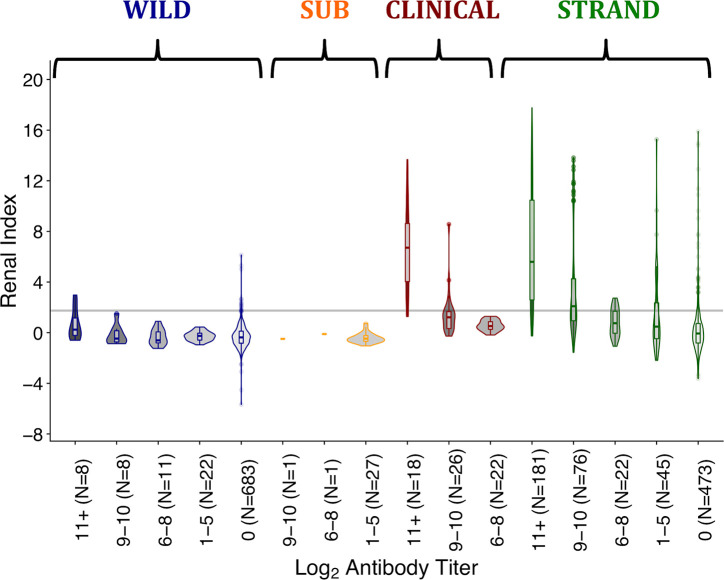
Fig 5. Renal index score distributions by log2 antibody titer level, for each sample group.
Sample groups are as described in the methods and are wild-caught (WILD), subclinical (SUB), clinical (CLINICAL), stranded (STRAND) sea lions. Titer groups were chosen based on the titer dynamics observed in the longitudinally followed animals through time. Groups roughly match the different phases of the host-pathogen relationship ranging from initial infection (11+), clinical recovery (9–10) and two stages of historic infection (1–5 and 6–8). Group 0 contains seronegative animals. The grey line denotes the upper boundary of the healthy range for renal index values. The upper whisker extends from the hinge to the highest value that is within 1.5 * IQR of the hinge, where IQR is the interquartile range. The lower whisker extends from the hinge to the lowest value within 1.5 * IQR of the hinge.

