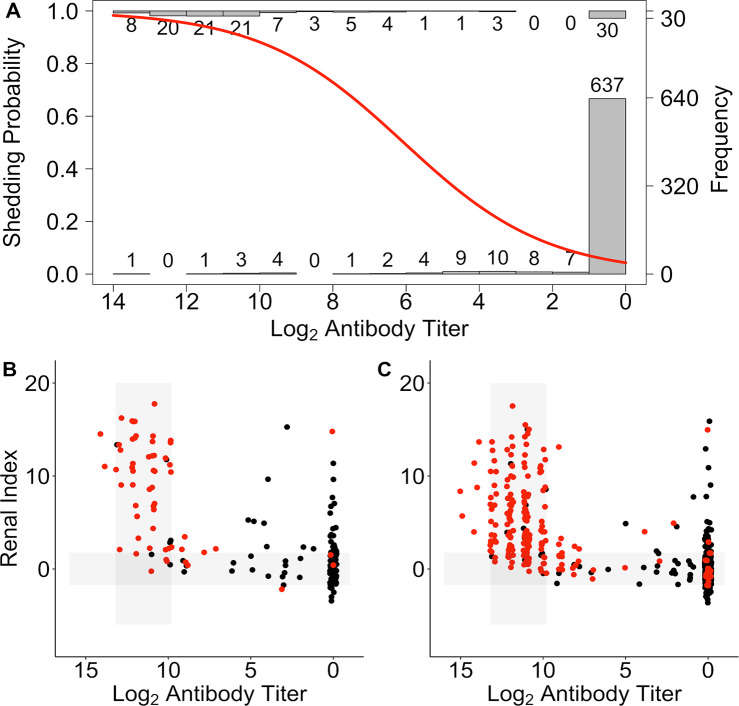
Fig 8. Shedding probability predicted from log2 anti-Leptospira antibody titer.
(A) The probability of shedding as a function of log2 anti-Leptospira antibody titer plotted over histograms of the number of animals shedding (top histogram) and not shedding (bottom histogram) by antibody titer (A). STRAND data plotted using the ‘host-pathogen map’ framework as in Fig 4C. Data divided into those individuals that were PCR tested and for which shedding status was known (B), and those that were not PCR tested and for which shedding status was predicted (C; positive = red, negative = black).

