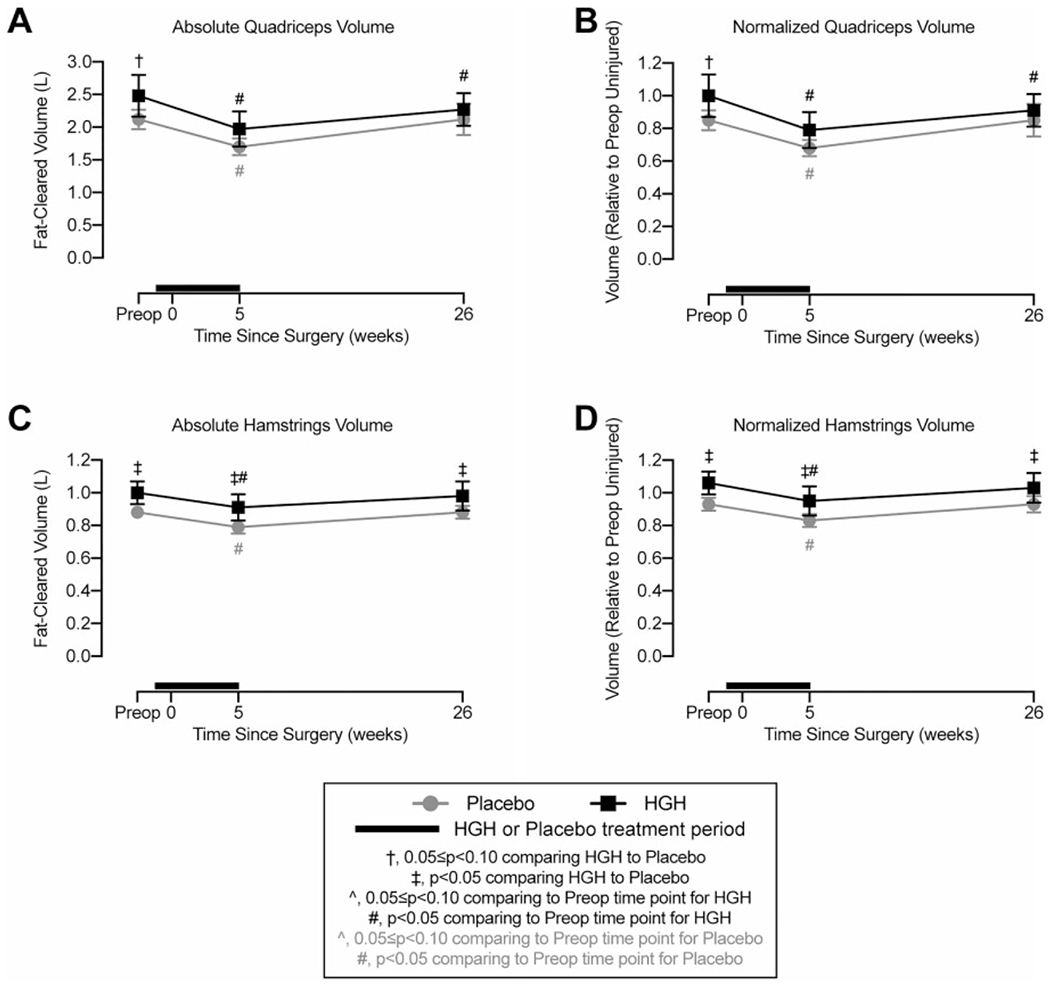
Figure 3.

Magnetic resonance imaging volume measurements. Changes in fat-cleared (A) absolute and (B) normalized quadriceps muscle volume and (C) absolute and (D) normalized hamstring muscle volume. Values are shown as mean ± 90% CI. Patients in the human growth hormone (HGH) group are shown in black, and those in the placebo group are shown in gray. The thick black line indicates the treatment window for HGH or placebo, with the preoperative time point occurring before initiating HGH or placebo treatment. Differences were tested using mixed-effects models. Significance: †.05 ≤ P < .10 comparing HGH with placebo at a given time point; *P < .05 comparing HGH with placebo at a given time point; ^.05 ≤ P < .10 comparing the postoperative time point with the preoperative time point within the same treatment group; #P < .05 comparing the postoperative time point with the preoperative time point within the same treatment group.
