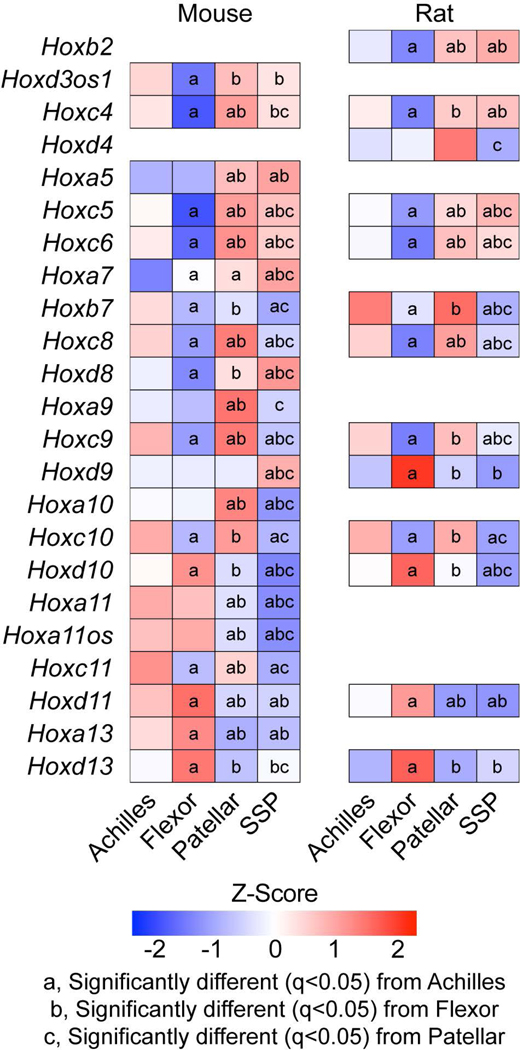
Figure 3. Hox genes.
Heat maps of Hox gene expression from mouse and rat samples from Achilles, forepaw digit flexor, patellar, and supraspinatus (SSP) tendons. Values are Z-scores from the distribution of log2 transformed counts per million mapped reads (CPM) of mouse and rat. Differences between tendons within a species tested using edgeR: a, significantly different (q<0.05) from Achilles tendons; b, significantly different (q<0.05) from forepaw flexor tendons; c, significantly different (q<0.05) from patellar tendons.

