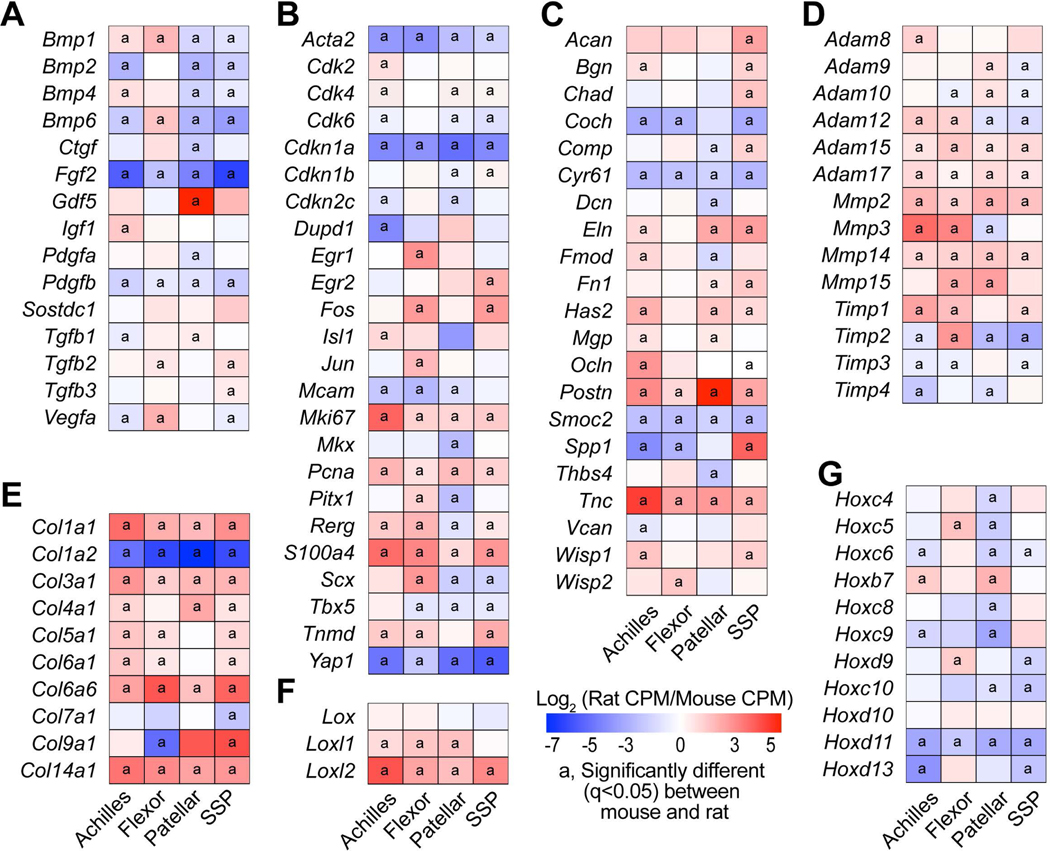
Figure 5. Orthologous transcriptional comparisons.
Heat maps of selected genes, including (A) growth factors and cytokines, (B) genes related to fundamental cell biology or tenogenesis, (C) proteoglycans and other non-collagen ECM molecules, (D) ECM proteases and their inhibitors. (E) collagens, (F) lysyl oxidases, and (G) Hox genes. Values are log2 counts per million mapped reads (CPM) of rat transcripts normalized to mouse transcripts. Differences between tendons within a species tested using edgeR: a, significantly different (q<0.05) from between mouse and rat samples for a given tendon.

