
Fig. 1. Broad spectrum calpain inhibition attenuates TGFβ-induced EMT in NMuMG cells.
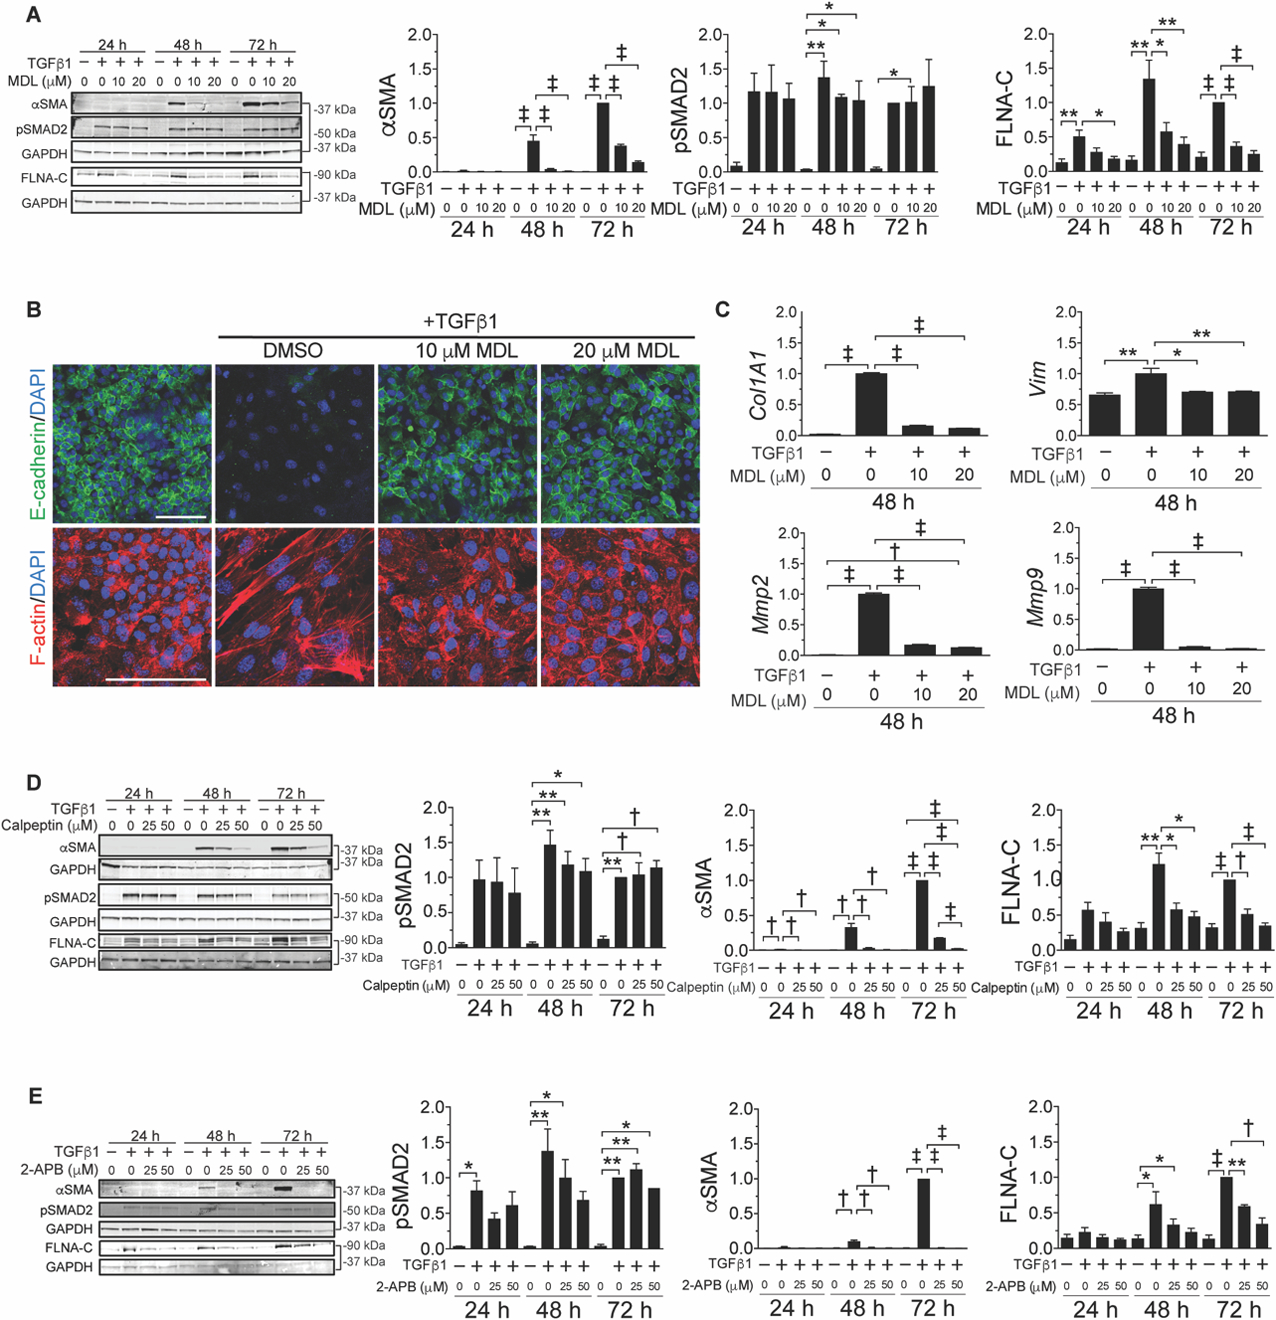
(A) Representative immunoblots (left, bracket indicates identical gel) and quantification (right, normalized to GAPDH) for the indicated proteins, time points after TGFβ stimulation, and concentrations of MDL-28170 (n =3 to 4). (B) Representative immunofluorescence images of TGFβ-induced EMT in NMuMG cells stained with E-cadherin (green), F-actin (red), and DAPI (blue). Scale bar: 100 µm. (C) Relative gene expression (normalized to Gapdh) in response to TGFβ with or without calpain inhibition (MDL) (n = 3). (D) Representative immunoblots (left) and quantification (right) for the indicated proteins, time points after TGFβ stimulation, and concentrations of calpeptin (n = 3). (E) Representative immunoblots (left) and quantification (right) for the indicated proteins, time points after TGFβ stimulation, and concentrations the calcium channel blocker 2-APB (n = 3). Data are expressed as mean ± s.e.m. *P < 0.05, **P < 0.01, †P < 0.005, ‡P < 0.001 by one-way ANOVA with Tukey’s post hoc test.