
Fig. 3. Dimeric calpain inhibition suppresses TGFβ-induced mesenchymal transition in primary PAVECs.
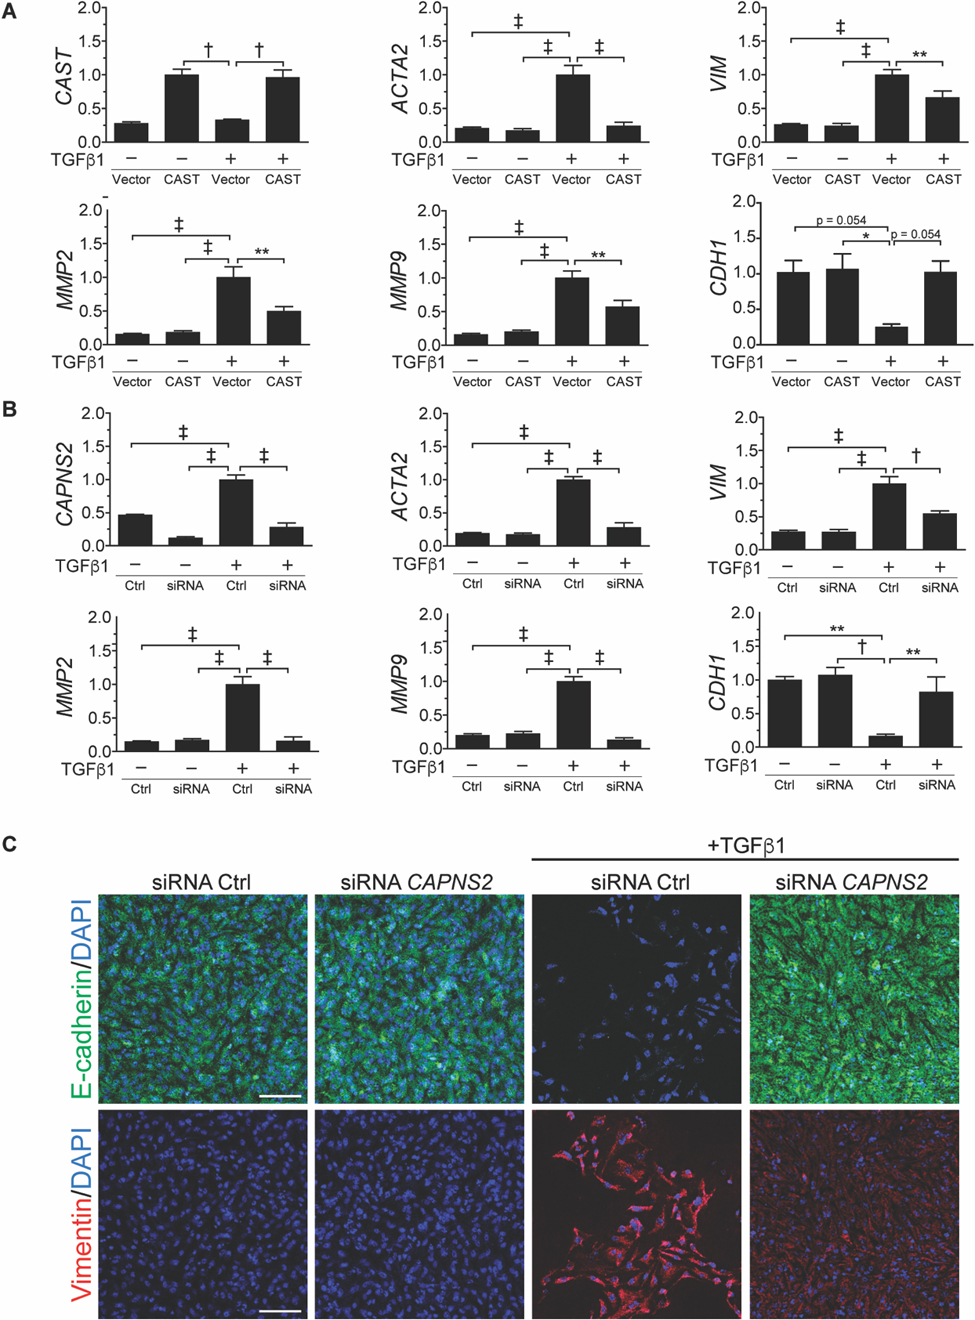
(A) Relative gene expression of PAVECs stimulated with TGFβ1 for 48 h with CAST overexpression normalized to GAPDH (n =3). (B) Relative gene expression (normalized to GAPDH) in response to TGFβ with or without siRNA knockdown of CAPNS2 (n = 3). (C) Representative immunofluorescence images of TGFβ-induced EnMT in PAVECs stained with E-cadherin (green), vimentin (red), and DAPI (blue). Scale bar: 100 µm. All quantitative data integrate each experiment performed in biologic quadruplicate. Data are expressed as mean ± s.e.m. *P < 0.05, **P < 0.01, †P < 0.005, ‡P < 0.001 by one-way ANOVA with Holm-Sidak post hoc test.