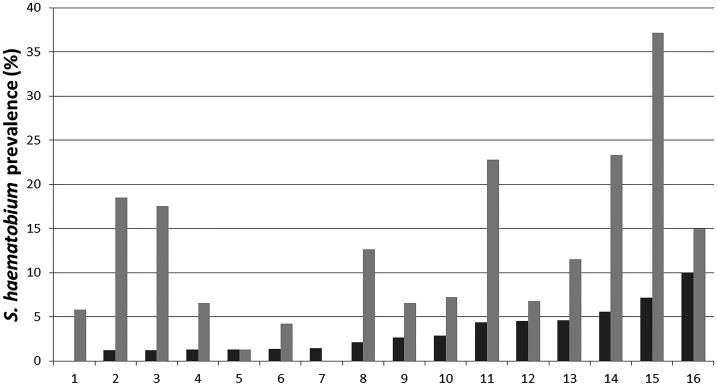
Figure 2.
Prevalence of Schistosoma haematobium was determined by the standard filtration of 10 mL urine (dark bars) and the UCAA2000 (light gray bars) applied to the same urine samples collected from children attending 16 schools on Pemba island. Figure redrawn, based on Knopp et al.35

