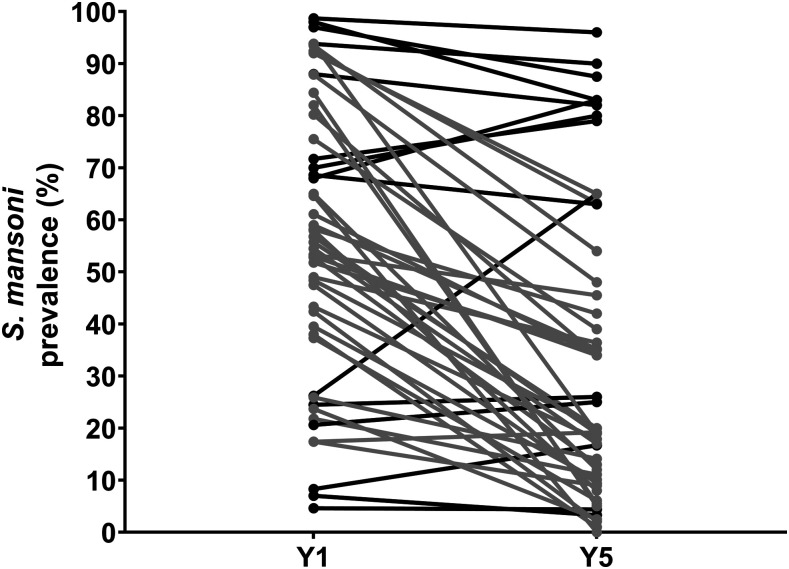
Figure 1.
Line graphs showing prevalence at baseline (Y1) and final survey (Y5) in individual villages in study arms that received 4 years of annual school-based treatment in the SCORE Kenya and Tanzania gaining control studies. Gray lines depict villages that showed ≥ 35% reduction in prevalence, whereas black lines depict villages with < 35% reduction in prevalence from baseline to year 5. This figure is a composite of data presented in Ref. 2.

