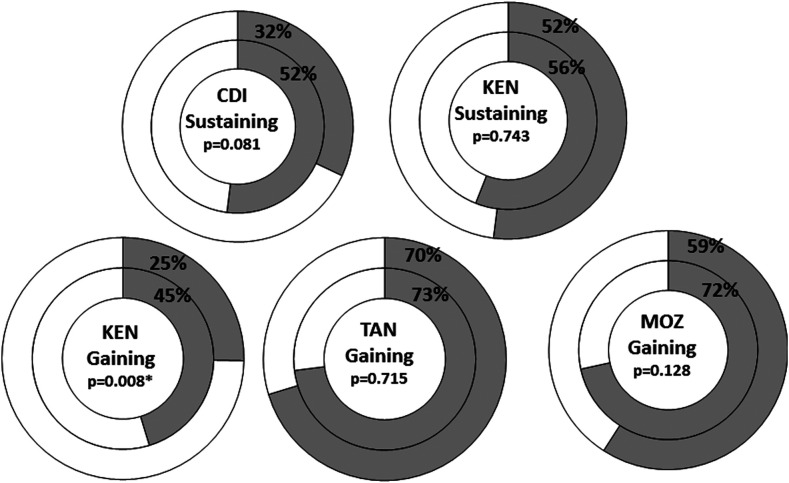
Figure 2.
Donut graph depicting the proportion of persistent hotspots in SCORE gaining and sustaining control studies in Year 5 in study arms that had mass drug administration (MDA) twice in 4 years (inner ring) compared with study arms that had MDA every year (outer ring). χ2 P-value is indicated for each comparison. * Indicates statistical significance at P < 0.05. The data in this figure are re-graphed from data presented in Ref. 2.

