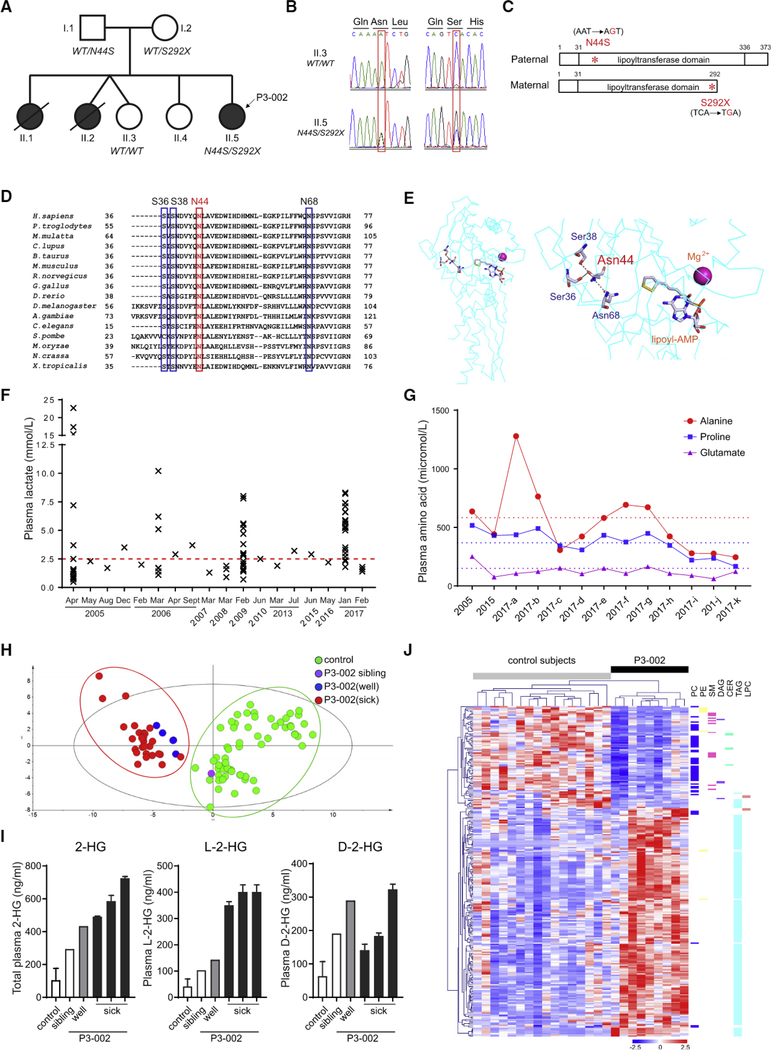
Figure 1. Metabolic Defects in a Patient with Compound Heterozygous Mutations of LIPT1.
(A) Patient (P3–002) and affected siblings are indicated in black. The LIPT1 genotype is indicated under the individuals subjected to molecular analysis.
(B) Chromatogram of LIPT1 sequences from the patient (II.5, P3–002) and healthy sibling (II.3).
(C) Schematic of LIPT1 proteins encoded from paternal and maternal alleles. The N44S and S292X mutations in the lipoyltransferase domain are indicated in red.
(D) Conservation of N44 (red frame) and three interacting residues (blue frames) in 16 species.
(E) Three-dimensional structure of bovine Liptl (left panel) and an enlargement (right panel) showing hydrogen bonding among Asn44, Ser36, Ser38, and Asn68. The locations of cofactors, AMP-conjugated lipoic acid (lipoyl-AMP) and magnesium ion, are also indicated.
(F) Plasma lactate concentrations from P3–002 over 12 years. The upper limit of the reference range (0.7–2.5 mmol/L) is indicated in red.
(G) Plasma alanine, proline, and glutamate in P3–002. The dashed lines indicate the upper limit of the normal range for each amino acid.
(H) Principal-component analysis (PCA) of plasma metabolomics from patient P3–002, the healthy sibling (II.3), and healthy controls (n = 60}.
(I) Quantitative plasma abundance of total 2-hydroxyglutarate (2-HG), L-2-hydroxyglutarate (L-2-HG), and D-2-hydroxyglutarate (D-2-HG) in P3–002, the healthy sibling (II.3), and controls (n = 6). Data are the mean and SD from two (sick) or six (control) replicates.
(J) Heatmap of plasma lipidomics showing species with variable importance in the projection (VIP) scores ≥1.0 between patient P3–002 and healthy controls (n = 16).

