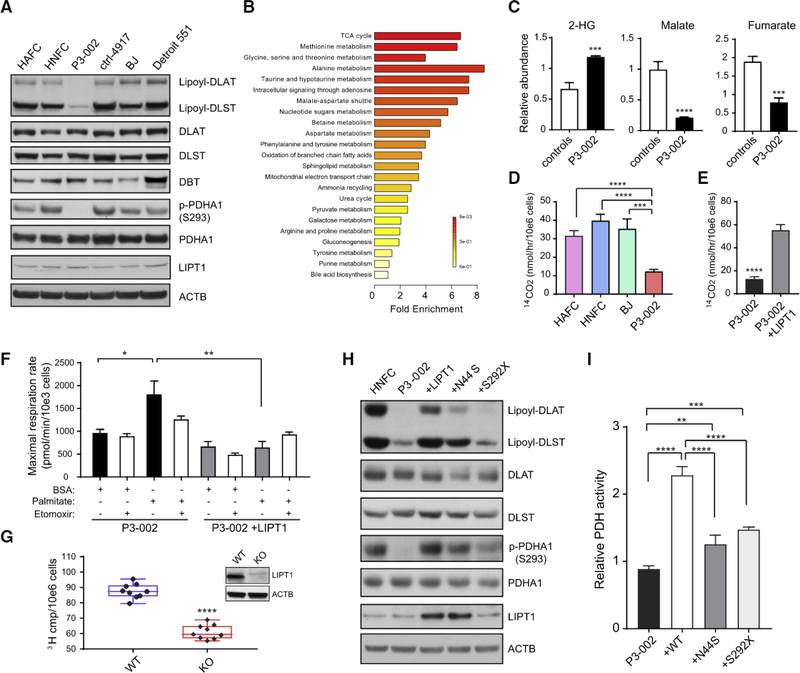
Figure 2. Functional Analysis of LIPT1 Variants in Patient-Derived Fibroblasts.
(A) Immunobiot analysis of primary human fibroblasts from five healthy subjects and patient P3–002. DLAT, DLST, and DBT are the E2 subunit of PDH, AKGDH, and BCKDH complexes, respectively.
(B) Metabolite set enrichment analysis of metabolites decreased in the P3–002 fibroblasts compared to the control primary fibroblasts. The metabolomic profiling was performed on primary human fibroblasts from five healthy subjects and patient P3–002.
(C) Comparison of selected metabolites determined by liquid chromatography-tandem mass spectrometry (LC-MS/MS) in the fibroblasts from five controls and patient P3–002. Data are the mean and SD from 3 replicates for P3–002 and 15 replicates for controls. An unpaired, two-tailed t test was used to assess statistical significance. ****p < 0.0001, ***p < 0.001.
(D) PDH activity determined by the amount of CO2 released from 14C-pyruvate in control primary fibroblasts and P3–002 fibroblasts. Data are the mean and SD from four replicates. ****p < 0.0001, ***p < 0.001, calculated by unpaired two-tailed t test.
(E) PDH activity measured by the amount of CO2 released from 14C-pyruvate in P3–002 fibroblasts with or without ectopic expression of WT LIPT1. Data are the mean and SD from four replicates. ****p < 0.0001, calculated by unpaired two-tailed t test.
(F) Seahorse assay to measure the maximal palmitate-stimulated respiration in P3–002 fibroblasts with or without ectopic expression of LIPT1. Data are the mean and SEM from six replicates. **p < 0.01, *p < 0.05, calculated by unpaired two-tailed t test.
(G) Lipogenesis rate measured with 3H2O in H460 cells containing or lacking LIPT1. Data are the mean and SD from nine replicates. ****p < 0.0001, calculated by unpaired two-tailed t test. The immunobiot analysis of LIPT1 is shown in the insert panel.
(H) Immunobiot analysis of human neonatal fibroblast cell (HNFC), P3–002 fibroblasts, and P3–002 fibroblasts with ectopic expression of WT LIPT1 or either of the two LIPT1 variants (N44S and S292X) observed in the patient.
(I) Relative PDH activity in P-3002 fibroblasts and in P3–002 fibroblasts with ectopic expression of the WT LIPT1 or the LIPT1 mutants (N44S and S292X). Data are the mean and SD from five replicates. ****p < 0.0001, ***p < 0.001, **p < 0.01, calculated by unpaired two-tailed t test.

