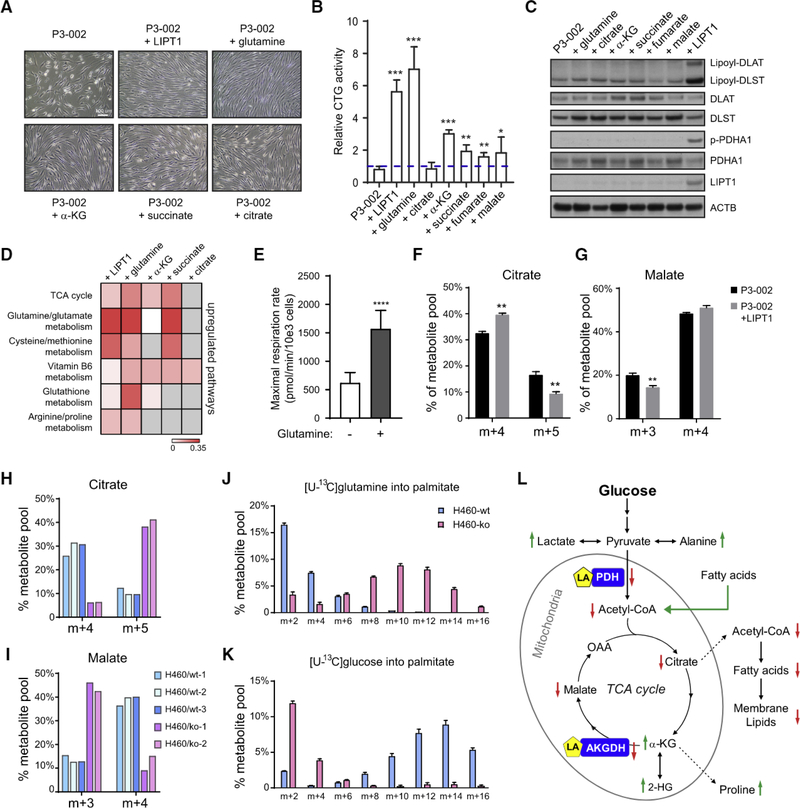
Figure 4. Oxidative and Reductive Glutamine Metabolism Support TCA Cycle Replenishment, Fatty Acid Synthesis, and Growth of LIPT1Deficient Fibroblasts.
(A) Representative phase contrast images showing the morphology of P3–002 fibroblasts in culture when LIPT1 was ectopically expressed or when the indicated metabolites were supplemented in conditional medium (2 mM glucose, 0 mM glutamine, 8mM galactose, and 2.5% dialyzed fetal bovine serum [FBS]). Scale bar: 100
(B) P3–002 fibroblast viability and bioenergetics were evaluated in conditional medium supplemented with the indicated metabolites for 48 h. The results are shown as mean and SD from three replicates, and p values are calculated by unpaired two-tail t test. ***p < 0.001, **p < 0.01, *p < 0.05.
(C) Immunoblot analysis of P3–002 fibroblasts cultured with the indicated metabolites in the conditional medium for 48 h.
(D) Heatmap of metabolic pathways enriched after LIPT1 expression or metabolite supplementation in P3–002 fibroblasts. The color scale represents the impact score on pathways using metabolomic pathway analysis (MetPA). Gray indicates no enrichment of the indicated pathway.
(E) Cellular respiration rate measured in P3–002 fibroblasts in the presence or absence of glutamine (2 mM). Data are the mean and SEM from eight replicates. ****p < 0.0001, calculated by unpaired two-tail t test.
{F) Fractional enrichment of the citrate isotopologues in P3–002 fibroblasts with or without ectopic LIPT1 expression (P3–002+LIPT1). The cells were cultured in [U-13C]glutamine for 24 h. Data are the mean and SD from three replicates. **p < 0.01, calculated by unpaired two-tail t test.
(G) Fractional enrichment of the malate isotopologues in P3–002 or P3–002+LIPT1 fibroblasts after culture with [U-13C]glutarmine for 24 h. Data are the mean and SD from three replicates. **p < 0.01, calculated by unpaired two-tail t test.
(H) Fractional enrichment of the citrate isotopologues in WT or L1PT1-knockout (KO) H460 cell clones after culture with [U-13C]glutamine for 6 h.
(I) Fractional enrichment of the malate isotopologues in WT or LIPT1-KO H460 cell clones after cultured with [U-13C]glutamine for 6 h.
(J) Mass isotopologue distribution in palmitate from WT or LIPT1-KO H460 cells after culture with [U-13C]glutamine for 24 h. Data are the mean and SD from three replicates.
(K) Mass isotopologue distribution in palmitate from WT or LIPT1-KO H460 cells after culture with [U-13C]glucose for 24 h. Data are the mean and SD from three replicates.
(L) Major metabolic alterations associated with LIPT1 deficiency in humans. Green arrows indicate elevation, and red arrows indicate reduction.

