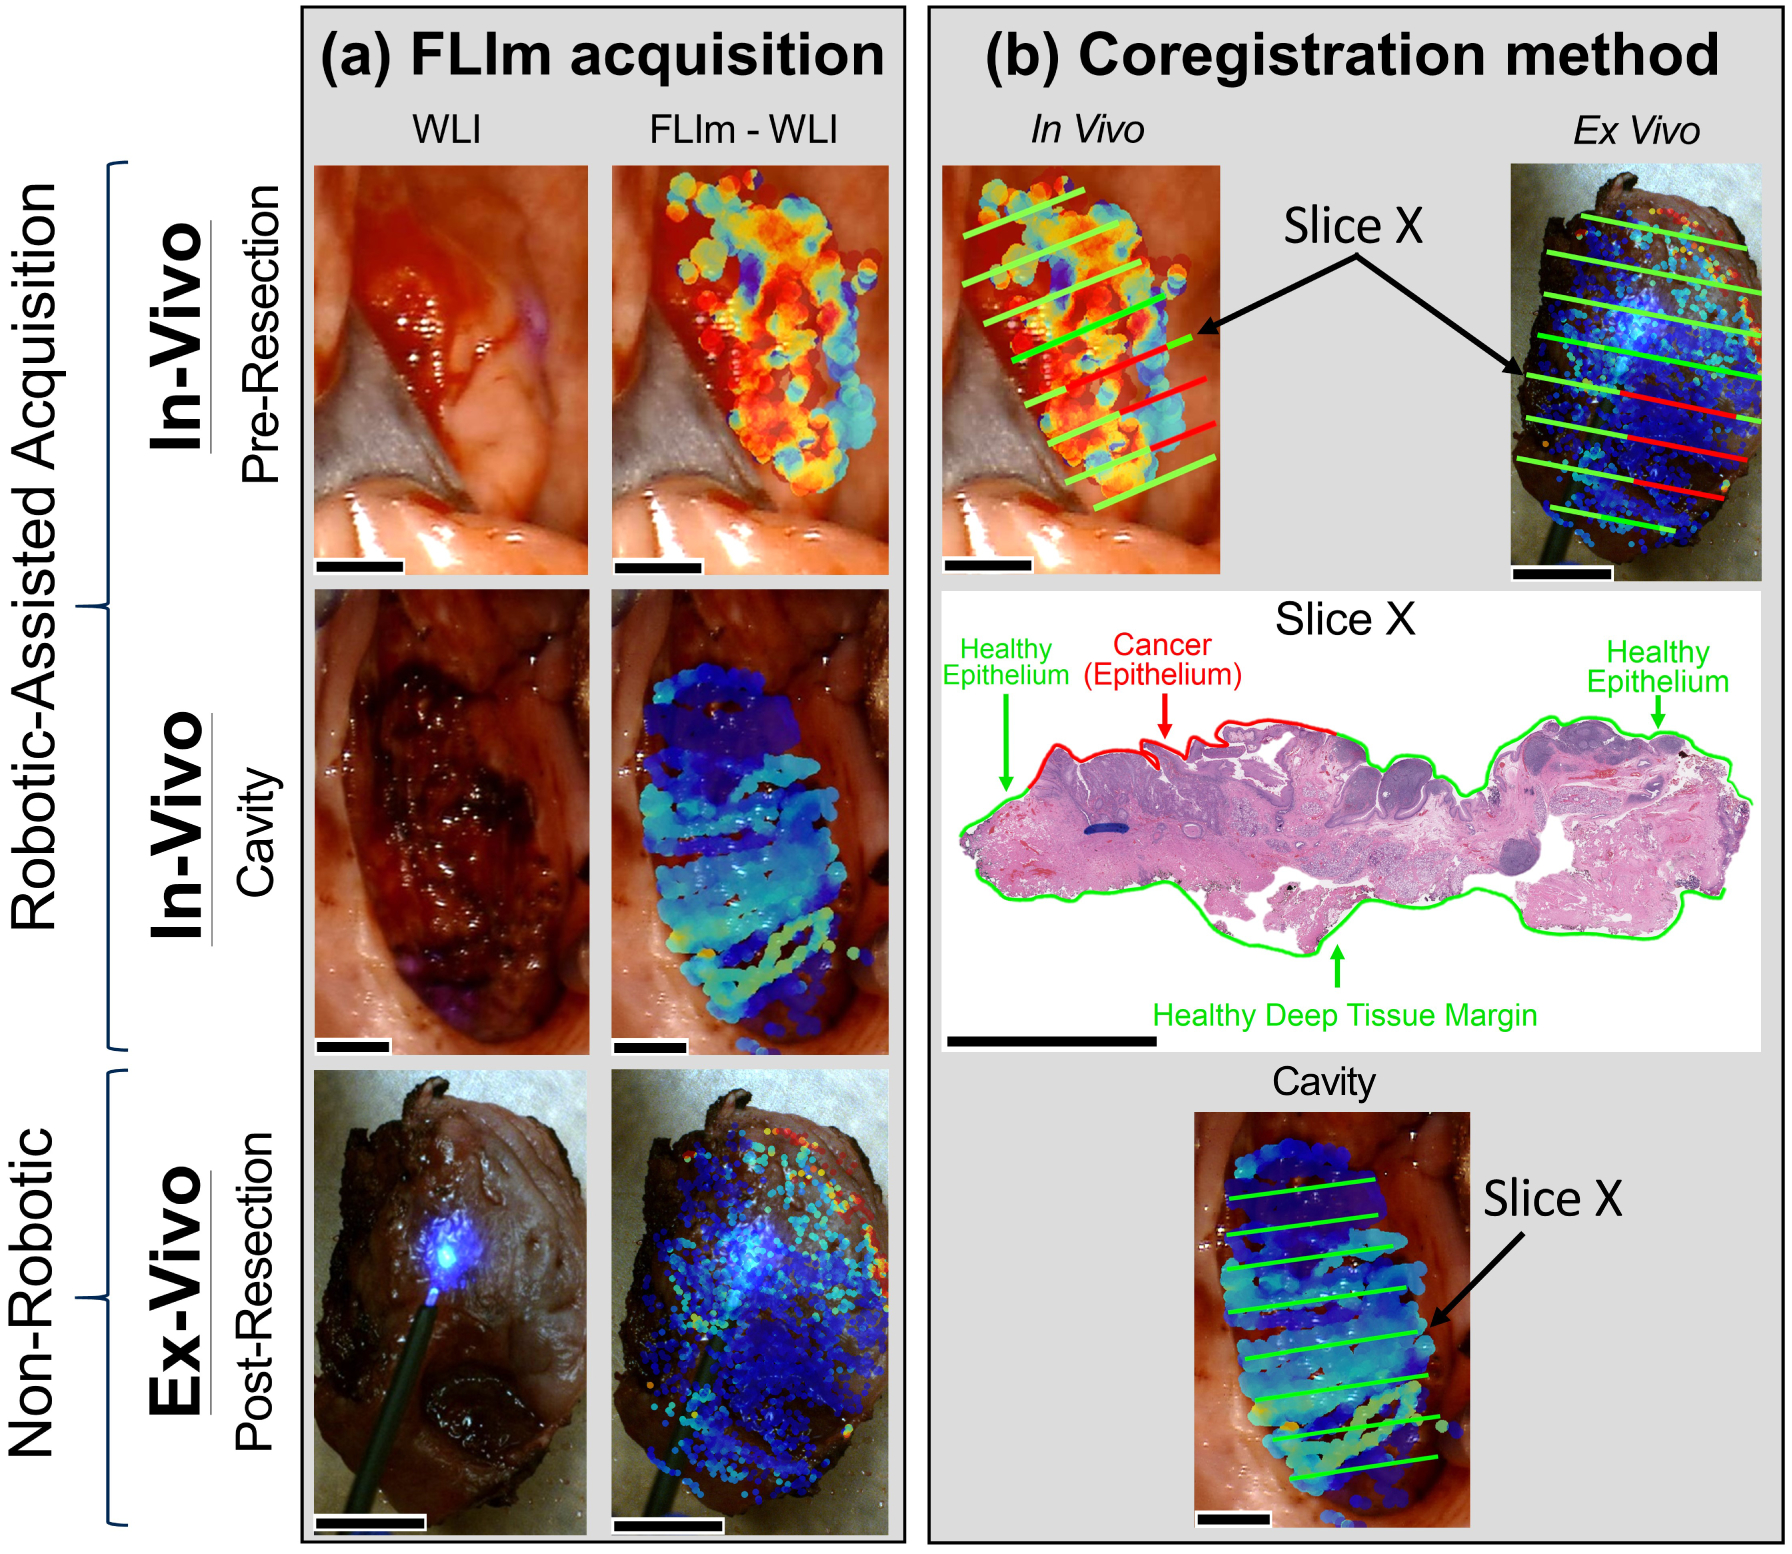
FIGURE 2.

Method for fluorescence lifetime imaging (FLIm) data acquisition and coregistration with tissue histopathology. (A) First, the in vivo pre-resection region of interest was identified by the surgeon (DGF, AFB, and MGM) as demonstrated in the white light image (WLI). A FLIm scan was performed at the anticipated cancer location to generate a FLIm-augmented WLI. Peripheral healthy tissue surrounding the cancer region was also included in the scan, where peripheral tissue was defined as a 10 pixel distance from the surgical margins (images are 1280 × 720 pixels for all scan types). Ten pixels correspond to approximately 0.75 mm. Second, following the cancer resection (facilitated by the da Vinci robot surgical platform) an in vivo post-resection scan was performed at the resection cavity. Surrounding peripheral tissue which was unaltered by the procedure was also included in the scan. Third, an ex vivo post-resection scan was performed on the surgically excised specimen. (B) In order to coregister FLIm data to histology, the surgically excised ex vivo specimen was first sliced in a grossing room under the surgeon’s direction and careful notes were acquired regarding the sectioning process. The sections (such as “Slice X” denoted in the figure tile) were then stained with hematoxylin and eosin and P16 antibodies, the pathologist (RGE) annotated the corresponding histology, and the results were extrapolated onto the respective slice ex vivo. The spatially oriented ex vivo specimen, along with clinical notes from the surgeon and pathologist, were used to perform subsequent coregistration in vivo at the pre-resection location using pathology annotations from the tissue surface. Post-resection (cavity) coregistration was performed using pathology annotations from the deep tissue margin (as indicated on the “Slice X” histology). All scale bars represent 0.5 cm
