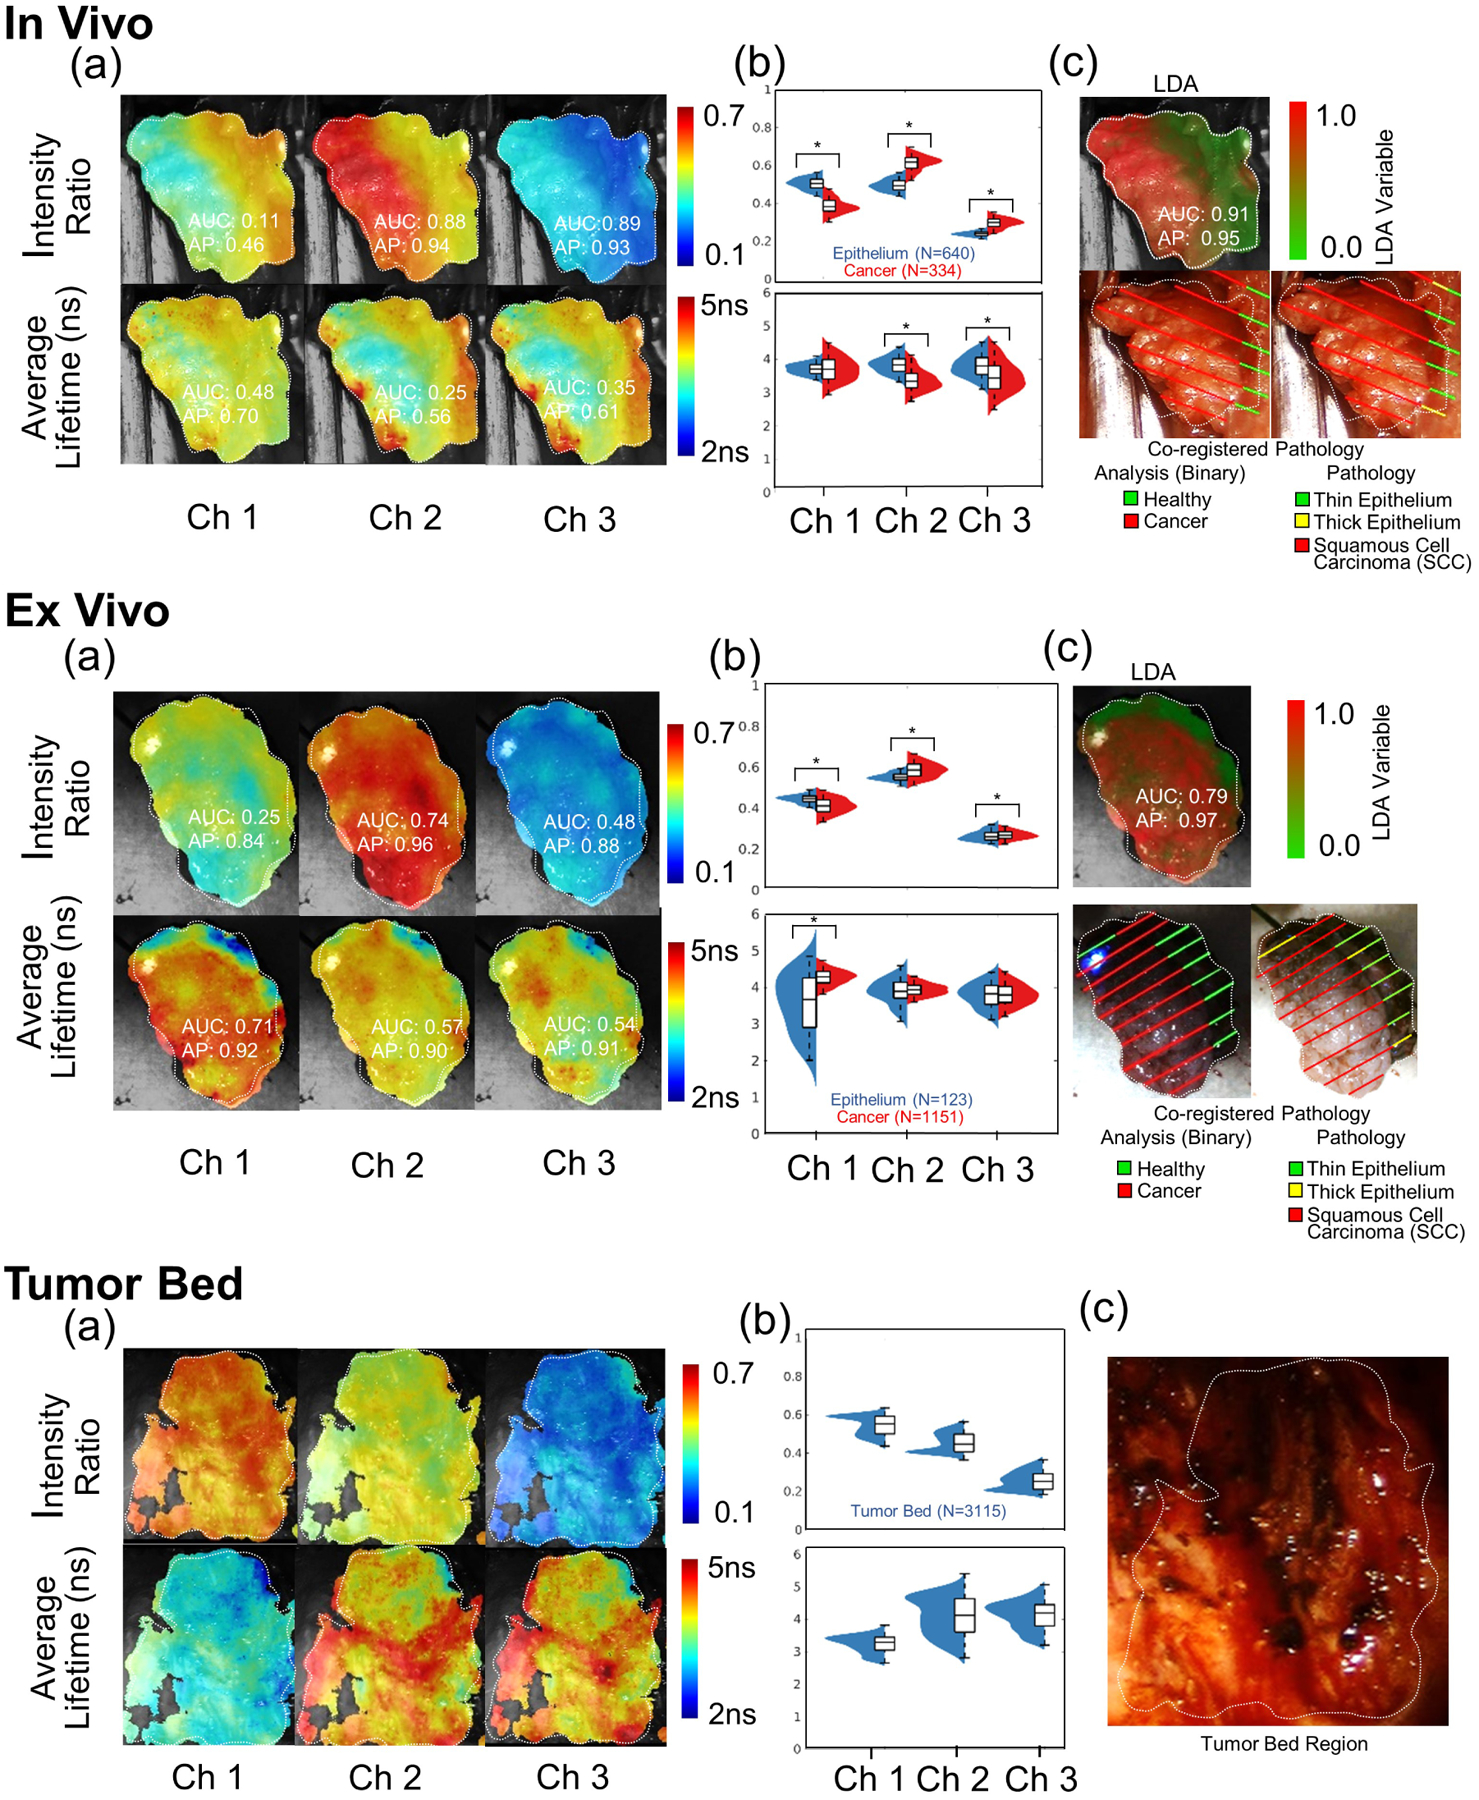
FIGURE 3.

Case study A (Patient 8): Upper panel: pre-resection in vivo scans. (A) Heat map visualizations of six fluorescence lifetime imaging (FLIm) parameters (three intensity ratios and three average lifetime values with corresponding area-under-the-curve [AUC] and average precision [AP] values). (B) Violin plots for the six FLIm parameters (statistical significance marked (*) for (P < .001). (C) Heat map visualization of the linear discriminant analysis (LDA) variable (corresponding AUC and AP values) with the coregistered pathology results (endothelial surface) mapped on the da Vinci camera while light video image. Thin (≤125 μm) and thick epithelium (>125 μm) regions (quantified by histology) were analyzed concurrently for the LDA analysis. Middle panel: post-resection ex vivo scans. (A) Heat map visualizations of six FLIm parameters (three intensity ratios and three average lifetime values with corresponding AUC and AP values). (B) Violin plots for the six FLIm parameters (statistical significance marked [*] for P < .001). (C) Heat map visualization of the LDA variable (corresponding AUC and AP values) with the coregistered pathology results mapped on the ex vivo mounted camera white light video image. For LDA analysis, thin and thick epithelium regions were analyzed concurrently. Bottom Panel: post-resection in vivo tumor bed scans. (A) Heat map visualization for six FLIm parameters. (B) Violin plots for six FLIm parameters depicting the broad distribution of cauterized healthy submucosa. Note: No residual tumor (positive margins) were found corresponding to the tissue deep margin surface. (C) White light image of the tumor resection bed
