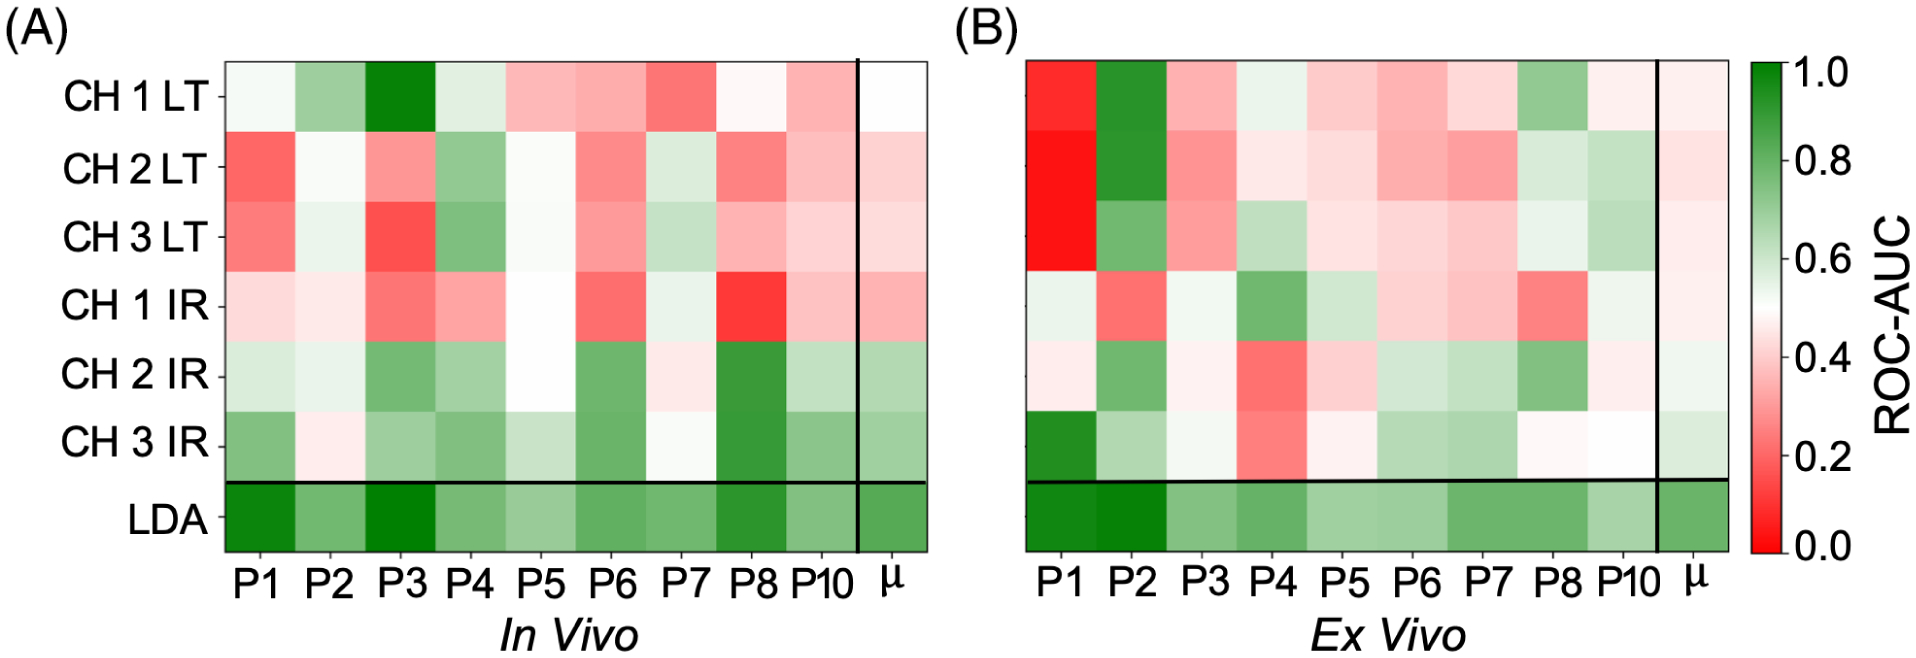
FIGURE 5.

A comparison of patient-level ROC-area-under-the-curve [AUC] performance for (A) in vivo pre-resection scans and (B) ex vivo post-resection scans. μ corresponds to the mean performance for each parameter including the linear discriminant analysis (LDA) variable. For each scan type, use of the LDA variable resulted in superior AUC to the best performing signal parameter, with a 0.07 ± 0.03 mean increase observed for the in vivo pre-resection scans and a 0.06 ± 0.03 mean increase observed for the ex vivo scans. A single parameter AUC score greater than 0.70 was observed for 6/9 in vivo pre-resection scan, and 4/9 ex vivo scans
