
FIG 2.
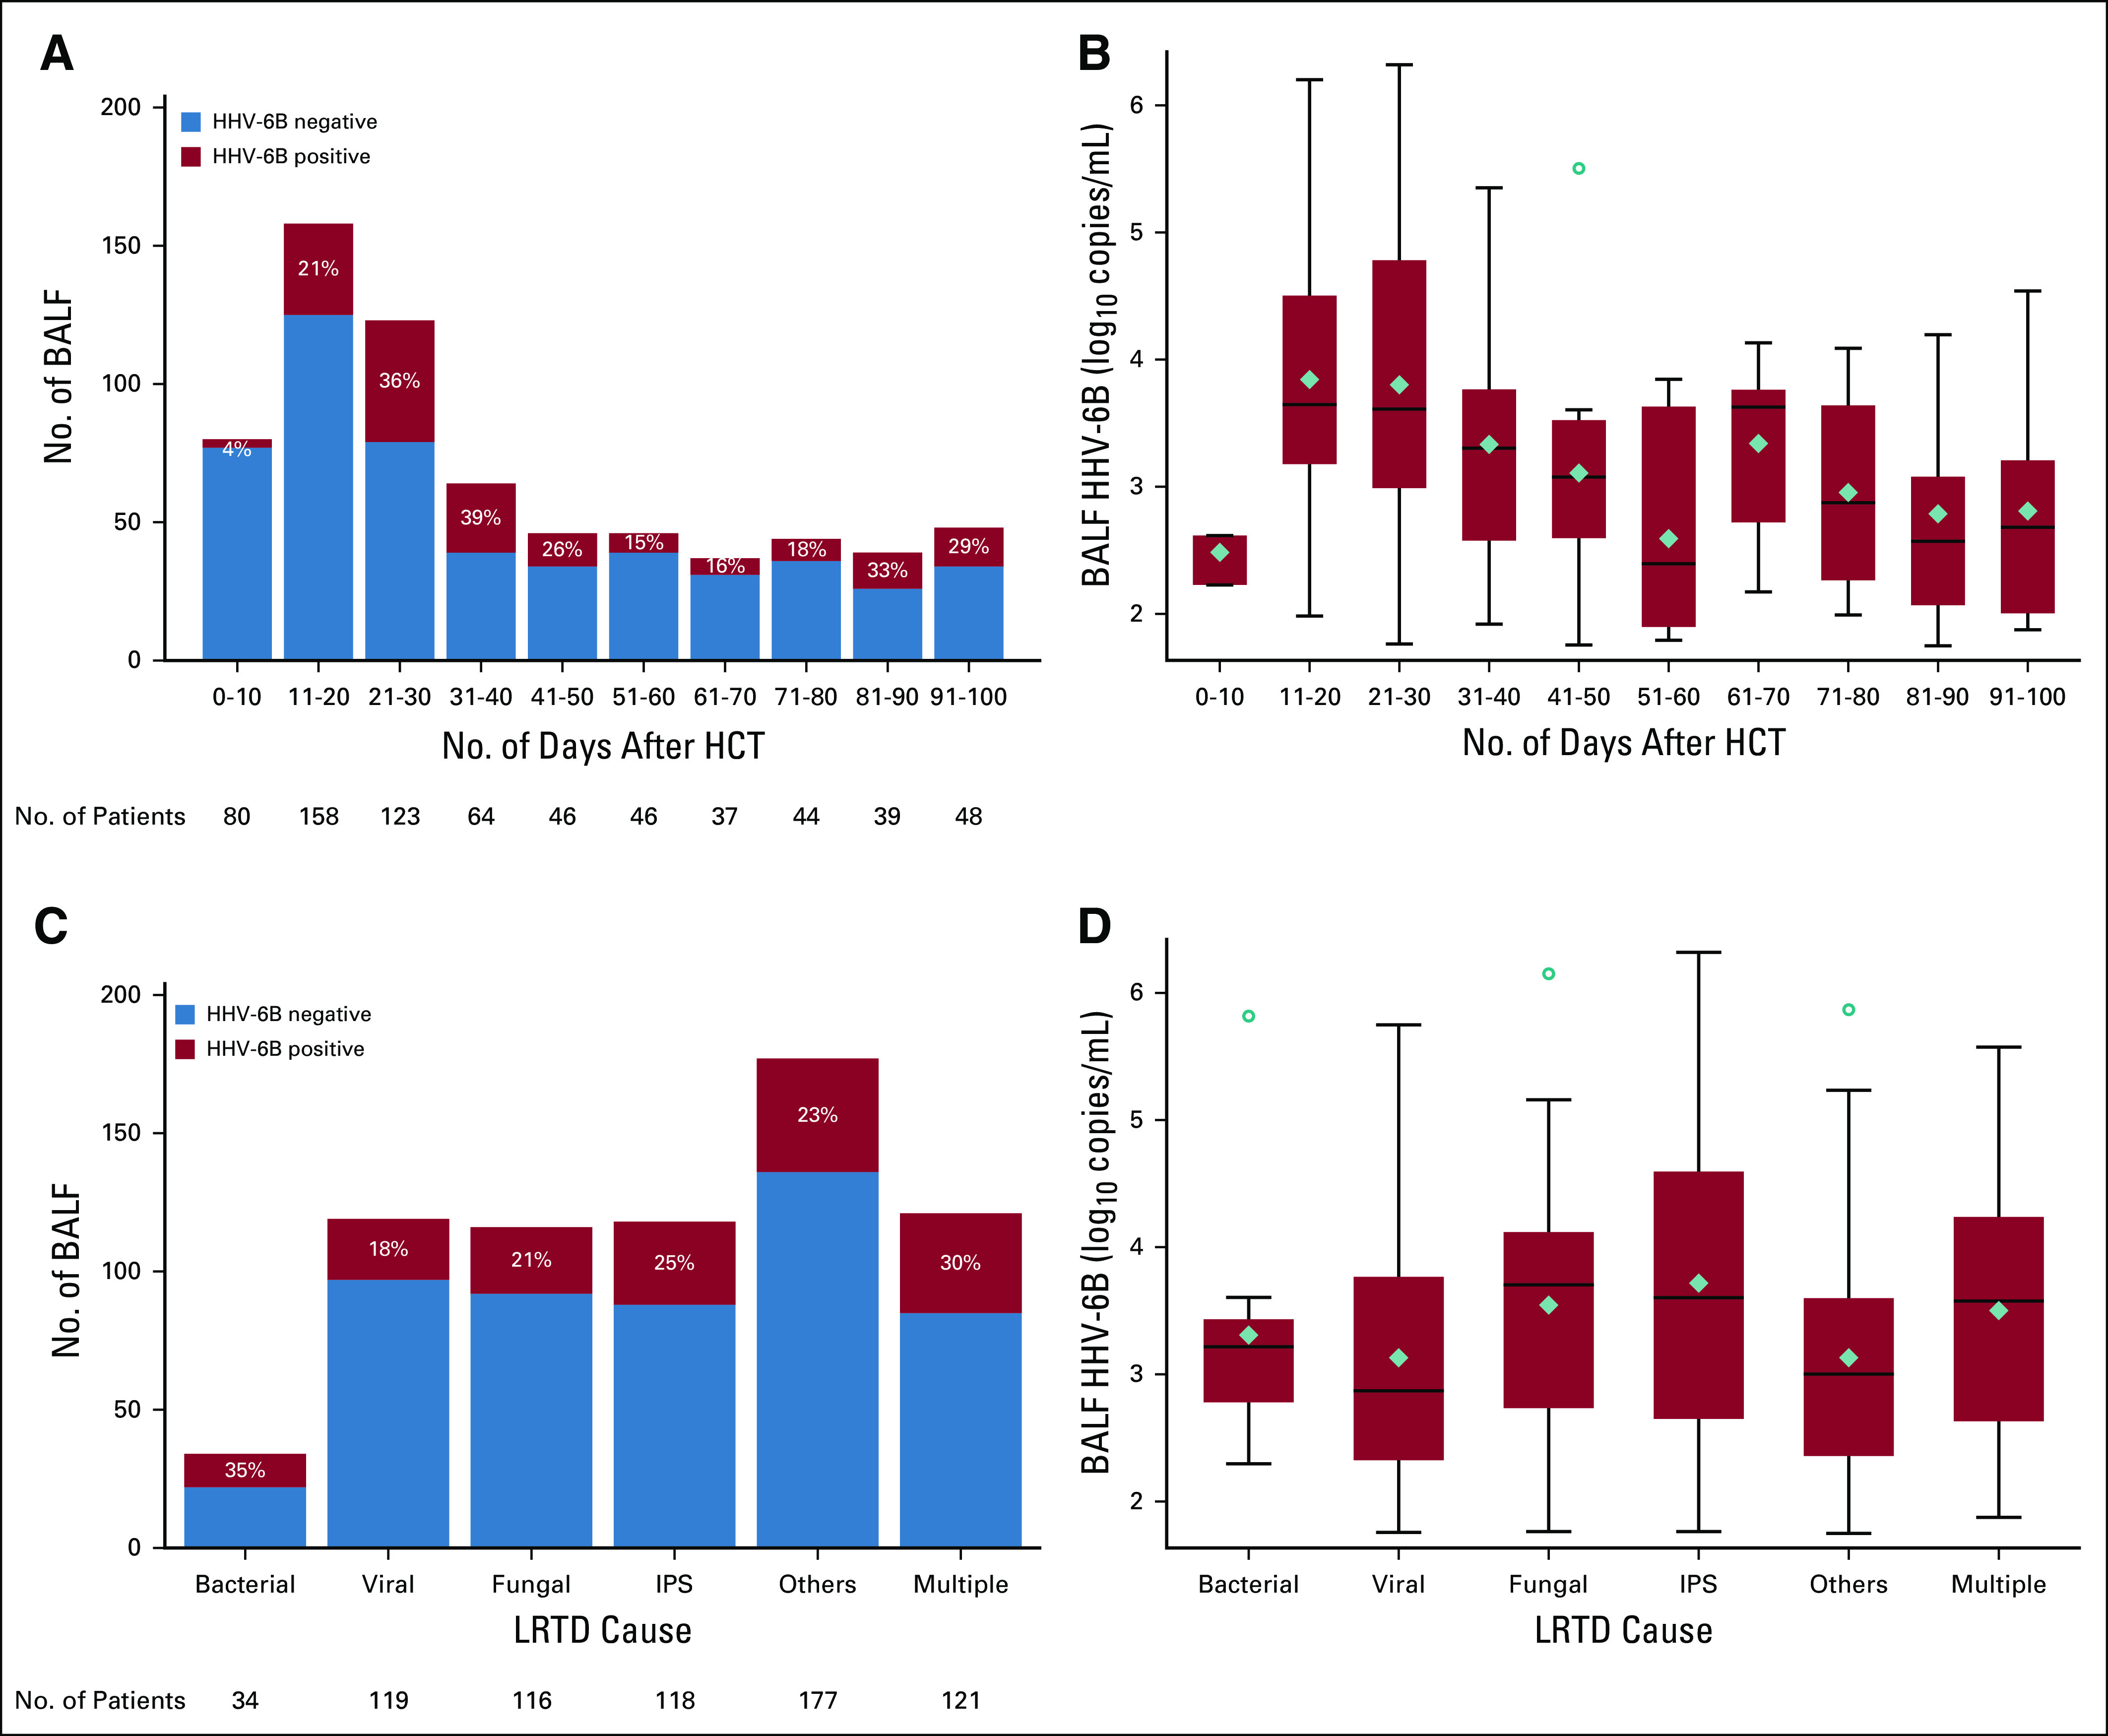
The distribution of human herpesvirus (HHV)-6B+ bronchoalveolar lavage fluid (BALF) detection and viral load after allogeneic hematopoietic cell transplantation (HCT). (A) A histogram of the number of BALF samples (N = 685) and the proportion of HHV-6B+ BALF (n = 165) over time after allogeneic HCT. (B) A box-and-whisker plot of the HHV-6B viral load over time among patients with HHV-6B+ BALF. (C) A histogram of the number of BALF samples and the proportion of HHV-6B+ BALF samples stratified by cause of lower respiratory tract disease (LRTD). (D) A box-and-whisker plot of the HHV-6B viral load stratified by cause of LRTD among patients with HHV-6B+ BALF. (B, D) The boxes represent the interquartile range, the horizontal lines and diamonds within the boxes represent the median and mean, respectively, and the upper and lower whiskers extend to the third and first quartiles ± 1.5 times the interquartile range, respectively. Circles represent data points that fall outside these parameters. IPS, idiopathic pneumonia syndrome.