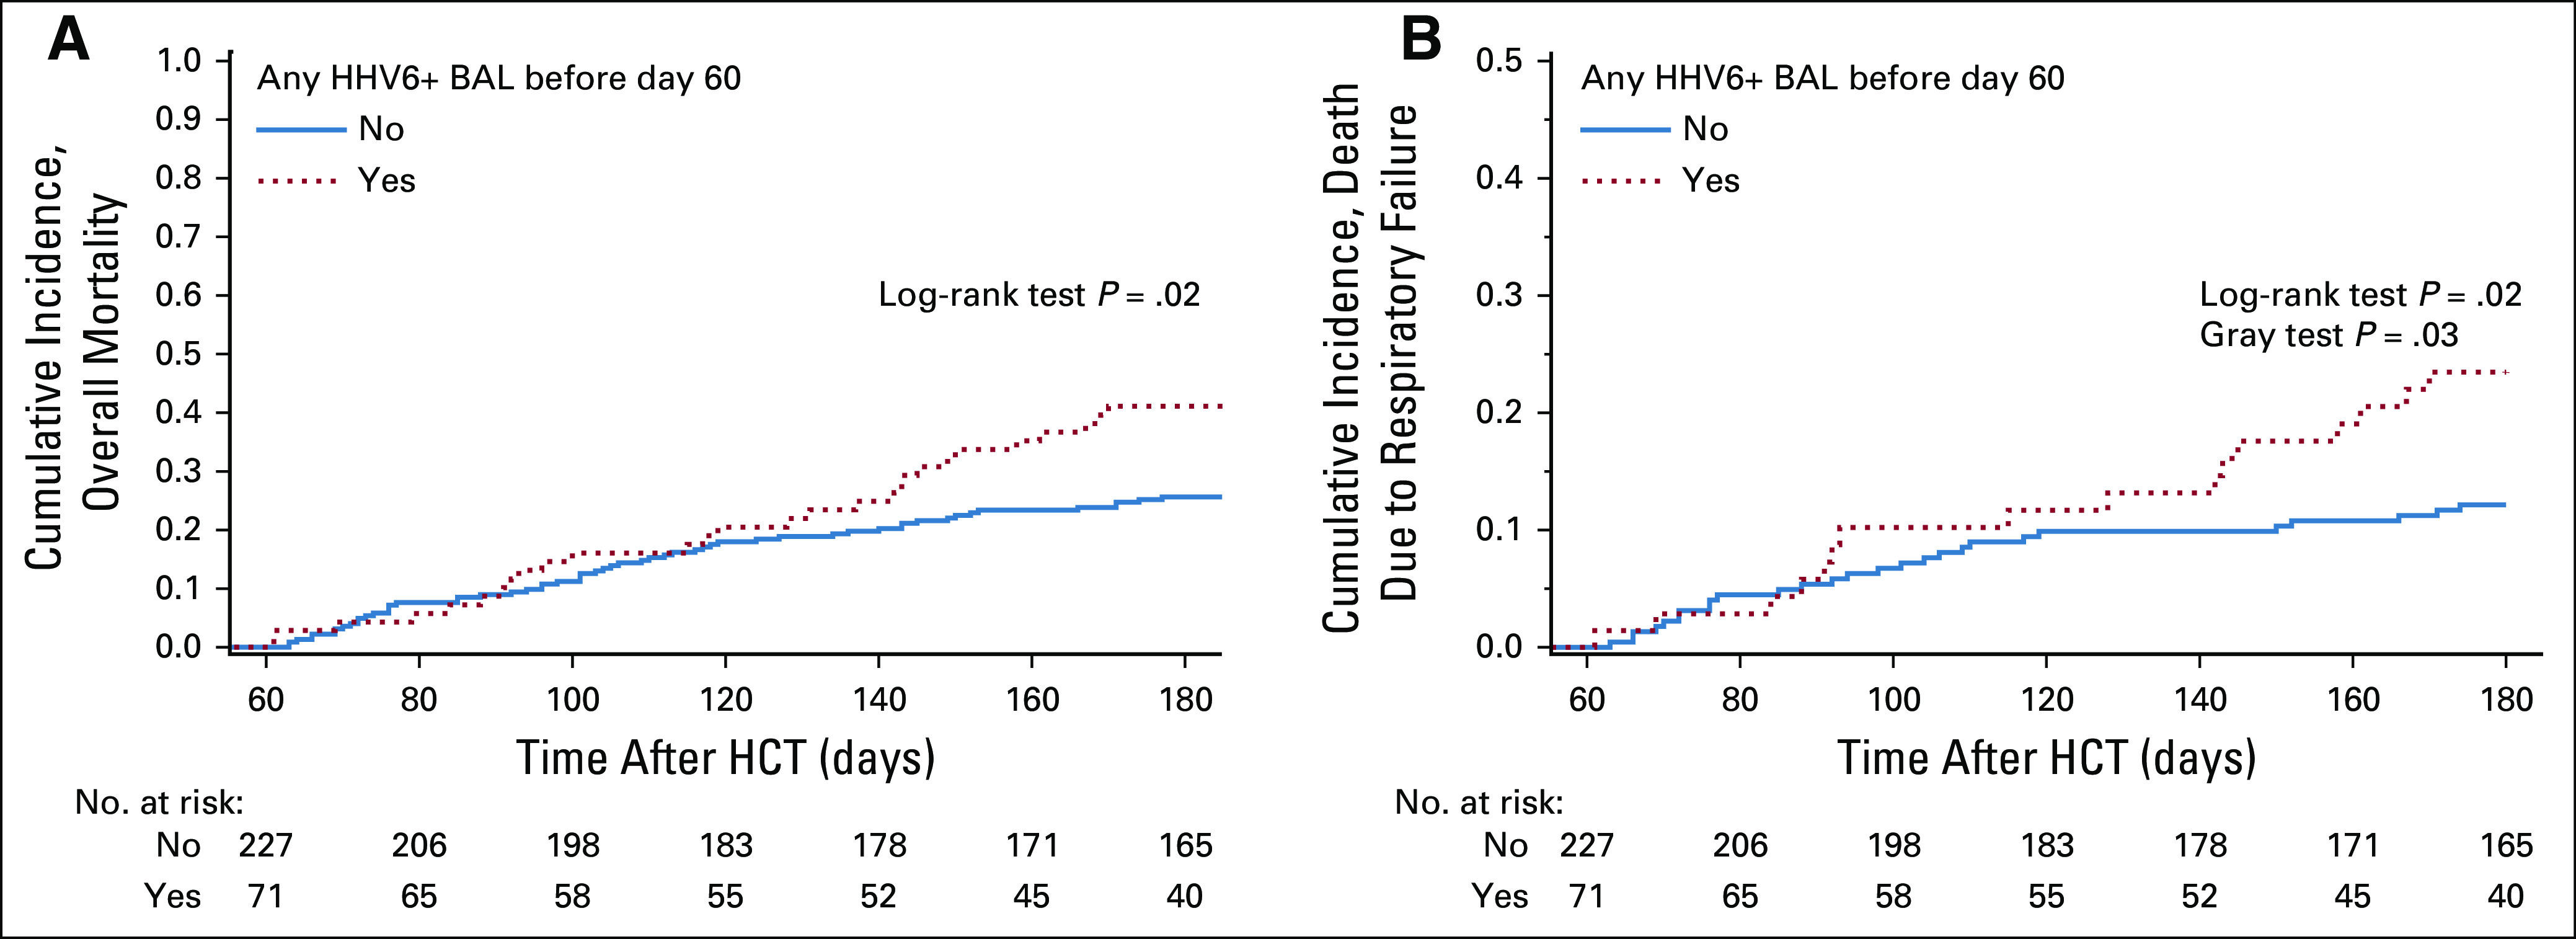
FIG 3.

Cumulative incidence curves of overall mortality and death from respiratory failure among subjects alive at day 60 after hematopoietic cell transplantation (HCT). The graphs are stratified by whether a subject had human herpesvirus (HHV)-6B detected in a BALF sample between day 0 and day 60 after HCT. Only subjects who had a BAL for evaluation of lower respiratory tract disease after HCT were included in this study. (A) Cumulative incidence curve of overall mortality. (B) Cumulative incidence curve of deaths due to respiratory failure. Deaths due to other causes were treated as competing risk events.
