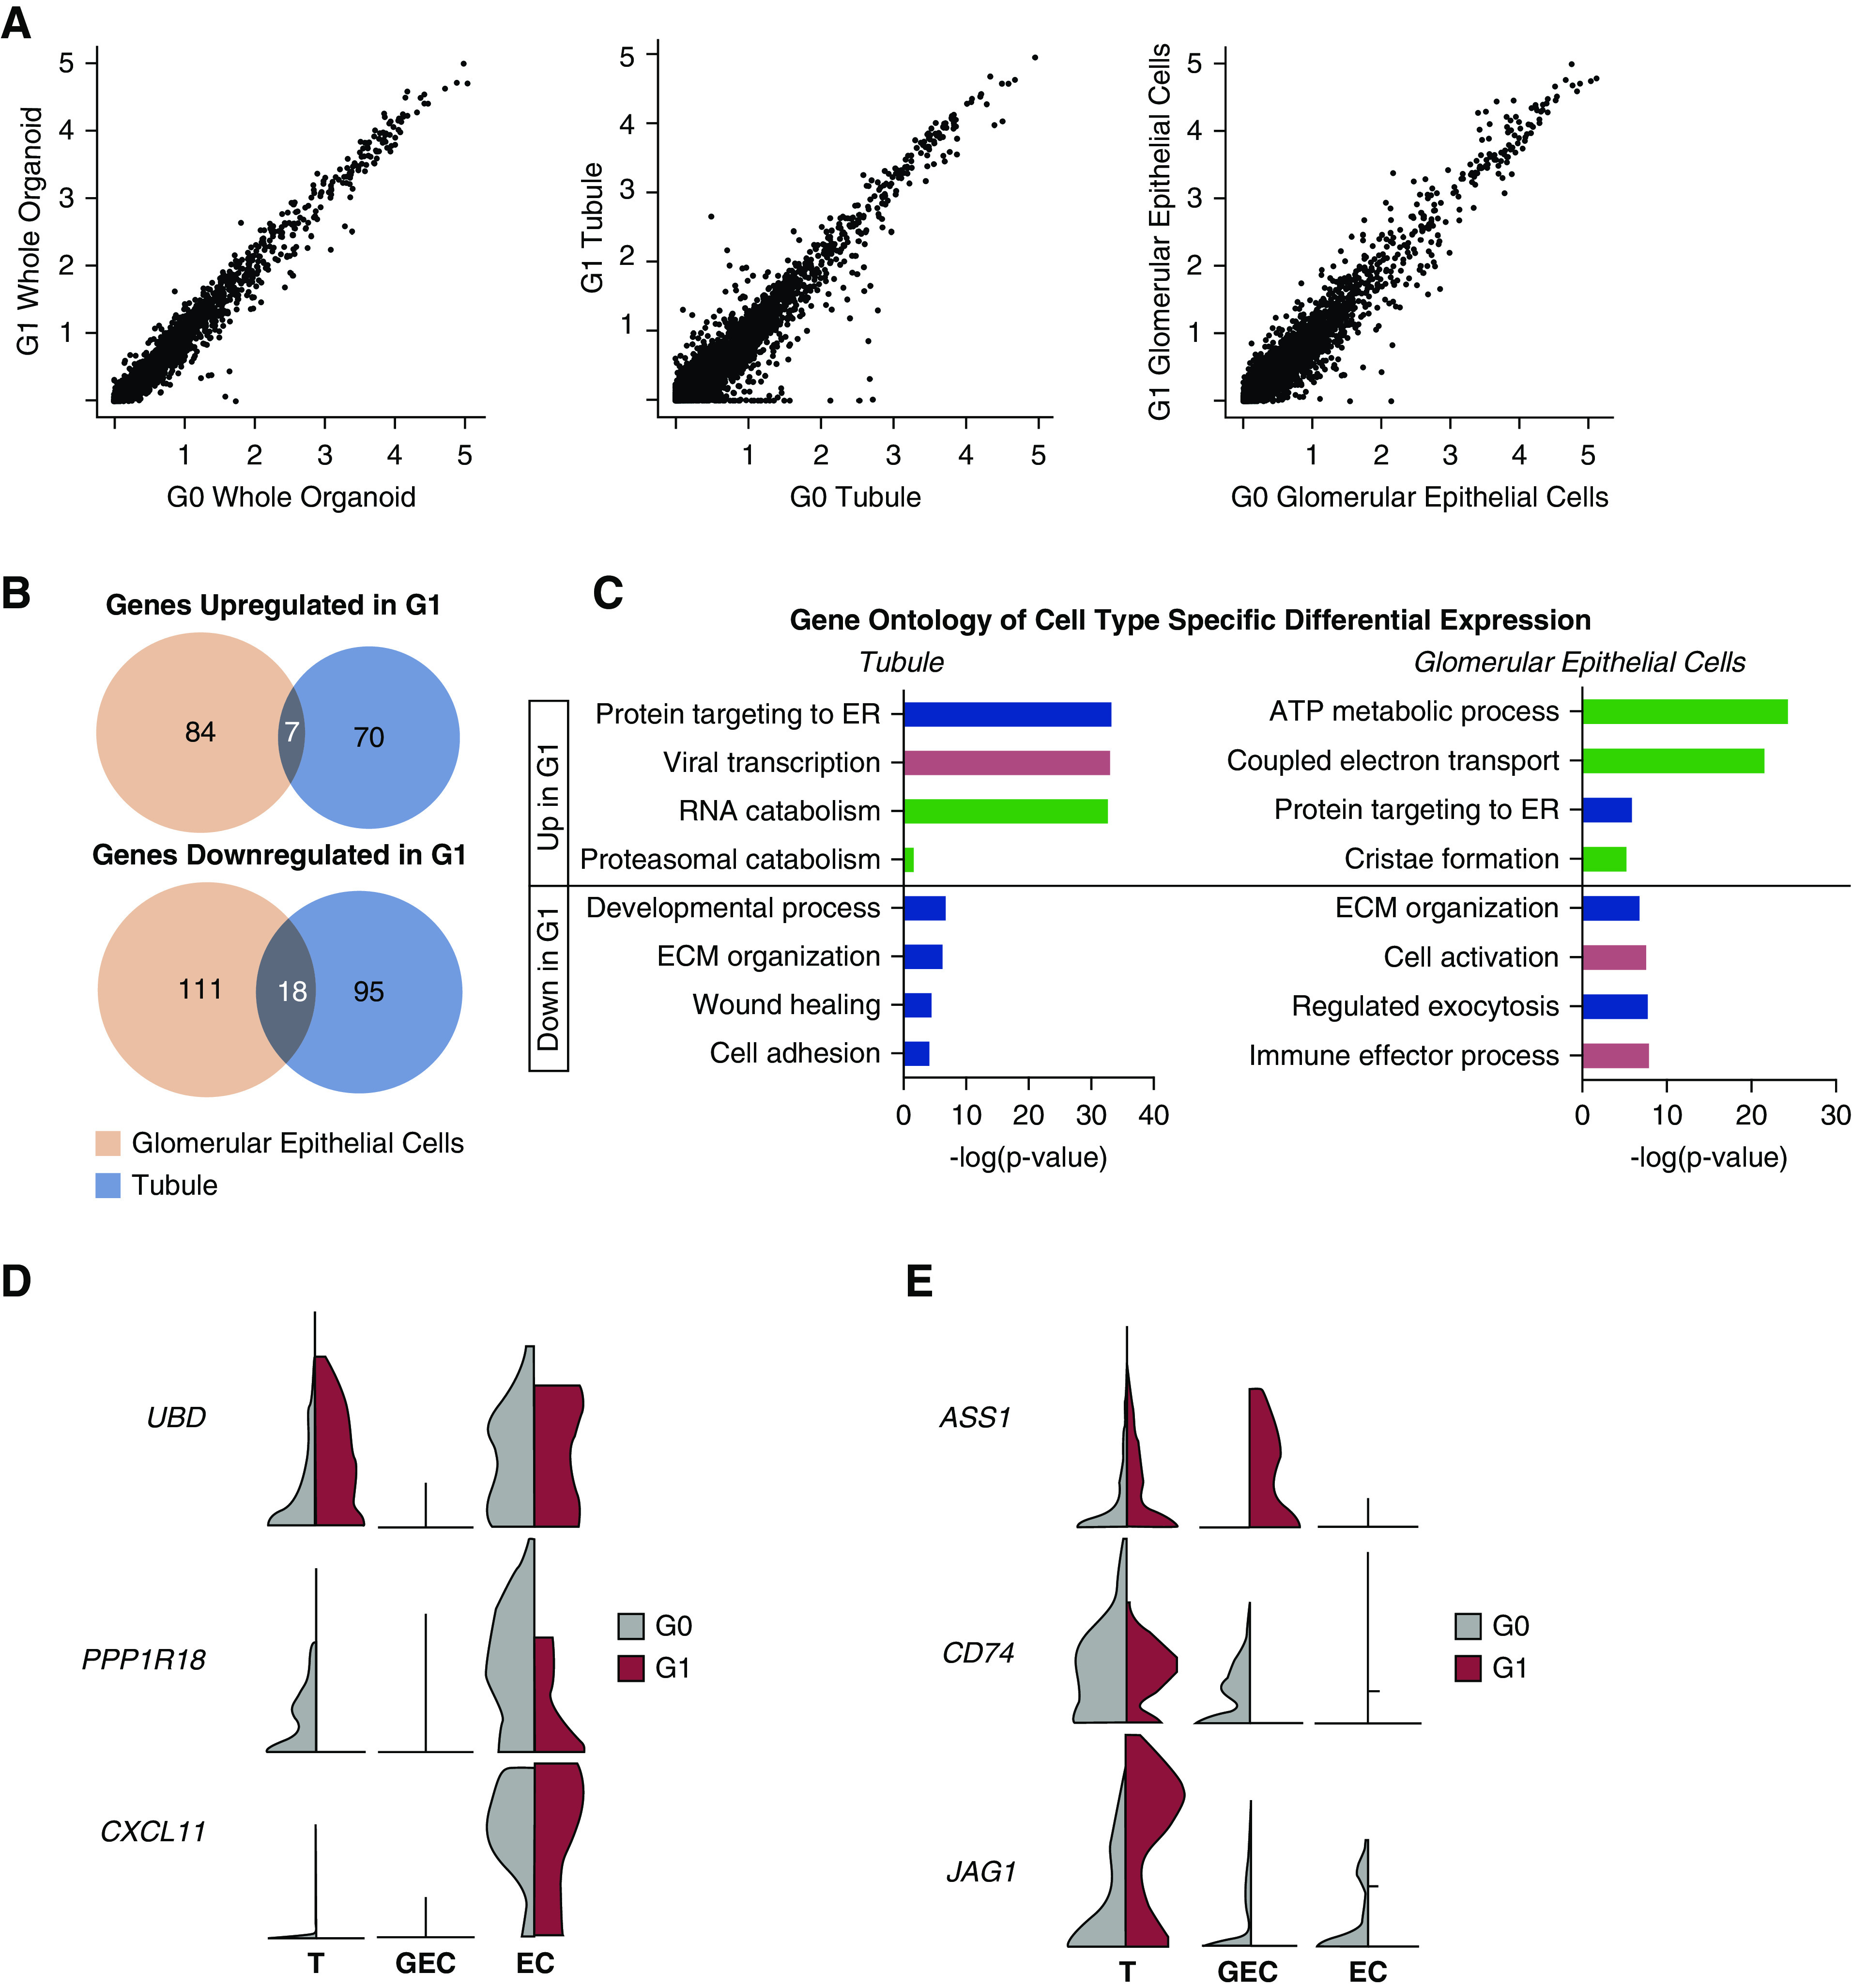
Figure 4.

scRNA-seq reveals cell type–specific differential expression patterns between G0 and G1 organoids treated with IFN-γ. (A) Scatterplots of G0 versus G1 organoid gene expression values across all cell types (left), among tubular cells (middle), and among glomerular epithelial cells (right). Greater variance is seen in the cell type–specific plots. (B) Venn diagrams show little overlap of expression patterns across cell types when comparing which genes are upregulated in G1 IFN-γ stimulation over G0 IFN-γ stimulation. There is similarly low overlap across cell types for genes downregulated in G1 IFN-γ stimulation. (C) Gene Ontology of the differentially expressed genes within each cell type, with −log(P-value) plotted for each biologic process. Metabolic (green), stress (pink), cell and organelle function (purple), collagen/matrix (gray). (D) Violin plots visualizing cell type–specific expression patterns of putative regulators (24,33,34) of APOL1 abundance. (E) Violin plots visualizing cell type–specific expression patterns of novel genes. ECM, extracellular matrix; ER, endoplasmic reticulum; T, tubule.
