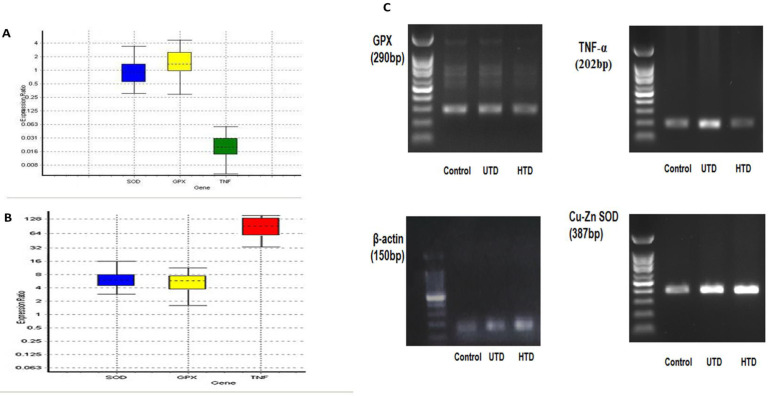
Figure 4.
A) Box plot indicates renal gene expression ratio of Cu-Zn SOD, GPX, and TNF-α, in the UTD group. B) Box plot indicates renal gene expression ratio of Cu-Zn SOD, GPX, and TNF-α in the HTD group. Boxes represent the interquartile range or the middle 50% of observations. The dotted line represents the median gene expression. Whiskers represent the minimum and maximum observations. C) Agarose gel electrophoresis (1%) of real time-PCR amplification of β-actin, Cu-Zn SOD, GPX, and TNF-α
β-actin: Beta-actin, (Cu-Zn) SOD: Cu-Zn Superoxide Dismutase, GPX: Glutathione Peroxidase, TNF-α: Tumor Necrosis Factor Alpha, UTD: Untreated Diabetic, HTD: His-Treated Diabetic

