Fig. 4.

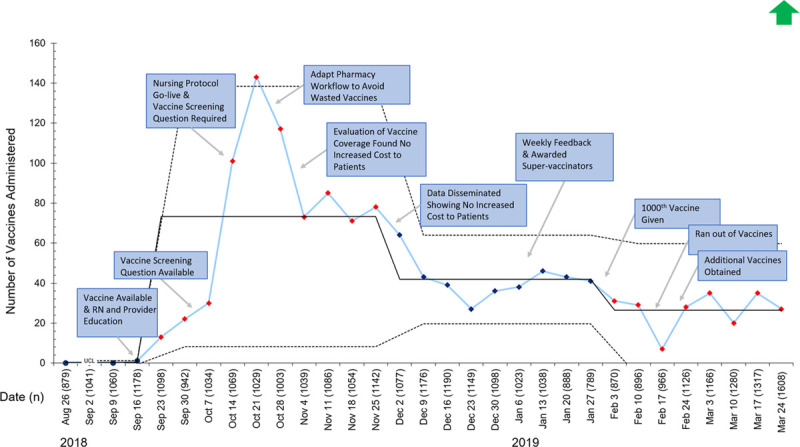
I chart representing a count of the number of influenza vaccines administered in the pediatric ED each week. Red and blue diamonds indicate a shift in the data. LCL, lower control limit; UCL, upper control limit.

I chart representing a count of the number of influenza vaccines administered in the pediatric ED each week. Red and blue diamonds indicate a shift in the data. LCL, lower control limit; UCL, upper control limit.