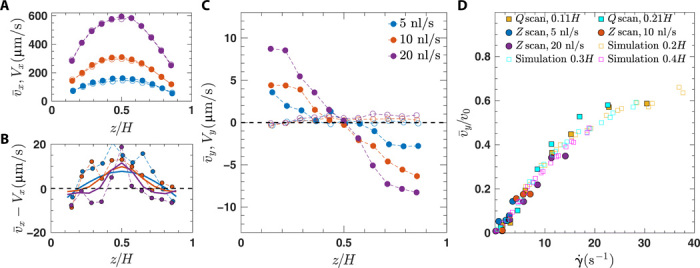
Fig. 2. Mean velocities for bacteria and passive tracer beads.

(A) Bacteria [] and bead [Vx(z)] velocities obtained by scanning through the z direction. Passive tracer beads with diameter d = 1 μm (empty circles) and bacteria (filled circles) are represented at mean flow rates of Q = 5 (blue), 10 (red), and 20 nl/s (purple). (B) Difference between bacteria and flow velocities . Results from simulations are shown by solid lines. (C) Corresponding mean rheotactic velocities and bead velocities Vy(z). (D) Rheotactic velocity normalized by the average bacteria swimming speed v0 as a function of local shear rate controlled by two methods: z scan, scanning through the channel height at given flow rates Q (5,10, and 20 nl/s), corresponding to the data of (B), and Q scan, varying flow rates at fixed channel height (0.11H and 0.21H). Results from simulations are indicated by open symbols and are given for heights 0.2H, 0.3H, and 0.4H.
