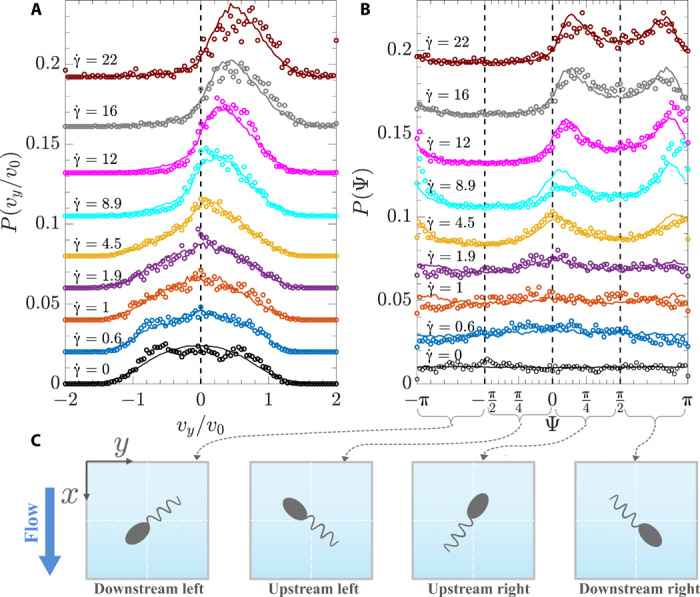
Fig. 3. Velocity and orientation distributions.

Experimental (symbols) and numerical (solid lines) results of (A) velocity vy and (B) orientation Ψ distributions obtained by varying the flow rate Q at a given distance from the channel bottom wall (z ≈ H/4). Local shear rates have been closely matched between experiments and simulations. For better readability, the different curves are shifted in the vertical direction. (C) Sketch of the bacterium orientation Ψ and relation to up- and downstream and left and right orientation.
