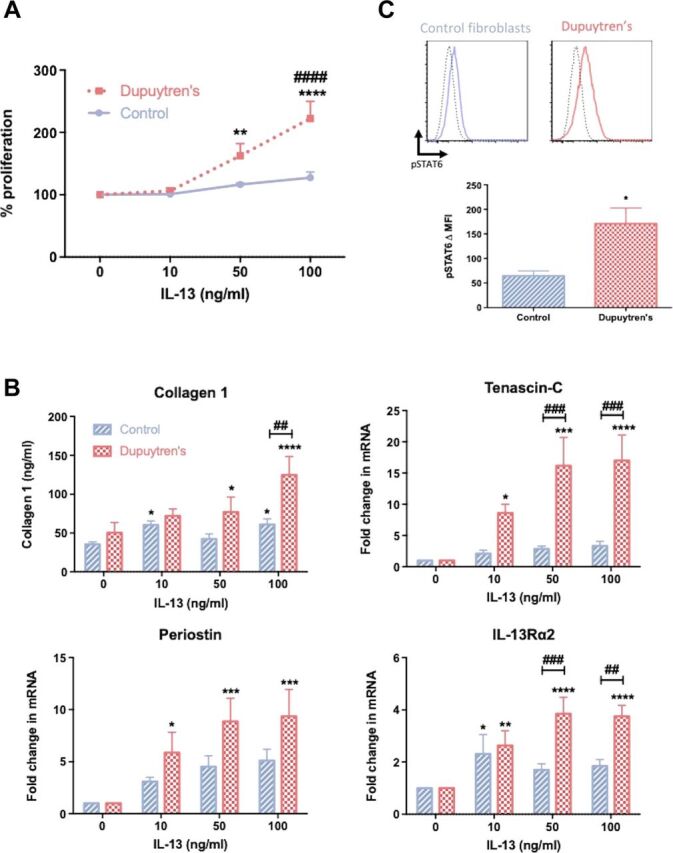
Fig. 2. IL-13 drives fibrosis in vitro.

(A) Effect of recombinant IL-13 on control fibroblast and Dupuytren’s myofibroblast proliferation, means ± SEM, n = 6; * indicates significant difference from untreated cells, **P < 0.01, ****P < 0.001; # indicates significant difference from control fibroblasts, ####P < 0.0001. (B) Effect of IL-13 on collagen 1 production and tenascin-C, periostin, and IL-13Rα2 gene expression; mRNA gene expression expressed as fold change following normalization to housekeeping gene [glyceraldehyde-3-phosphate dehydrogenase (GAPDH)] and then to relevant untreated cells, n = 6, * indicates significant difference from untreated cells, *P < 0.05, **P < 0.01, ***P < 0.001, ****P < 0.0001; # indicates significant difference from control fibroblasts, ##P < 0.01, ###P < 0.001. (C) Phosphorylation of STAT6 following IL-13 exposure in control fibroblasts and Dupuytren’s myofibroblasts. Flow cytometric histograms are representative of unstimulated (broken line) and IL-13 stimulated (solid line). Graph demonstrates the change in MFI after IL-13 stimulation, means ± SEM, n = 6; *P < 0.05. MFI, median fluorescence intensity.
