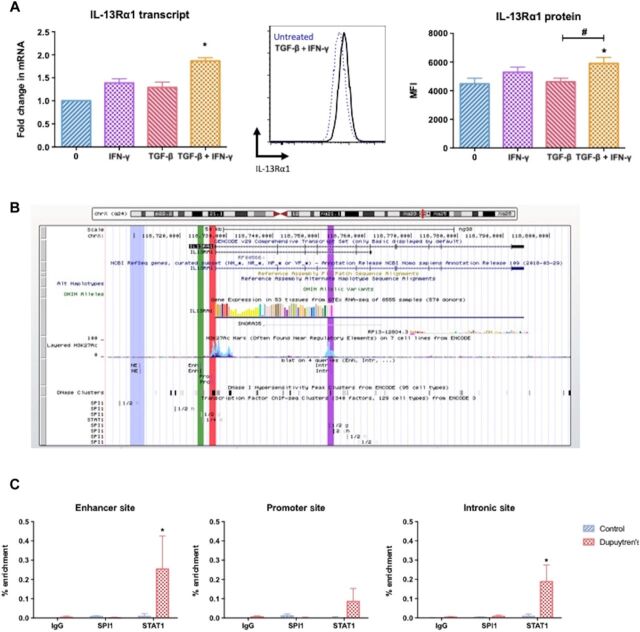
Fig. 4. STAT1 mediated dysregulation of IL13Rα1 in Dupuytren’s disease.
(A) Control fibroblasts exposed to IFN-γ and/or TGF-β. IL-13Rα1 transcript following treatment. Representative flow cytometry histogram of IL-13Rα1 expression on the surface of untreated, and graph illustrates MFI of IL-13Rα1 after treatment. All results are means ± SEM; mRNA gene expression expressed as fold change following normalization to housekeeping gene (GAPDH) and then to relevant untreated cells, n = 6; * indicates significant difference from untreated cells, *P < 0.05. #P < 0.05. (B) Identification of sites of interest on IL-13Rα1 gene locus: nonspecific (blue), enhancer (green), promoter (red), and intronic site (purple). (C) Quantitative polymerase chain reaction of ChIP representing percent enriched binding of SPI1 and STAT1 at different sites of interest of interest on the IL-13Rα1 gene. Graph demonstrates the percent enriched following subtraction of nonspecific enrichment, means ± SEM, n = 4; *P < 0.05.

