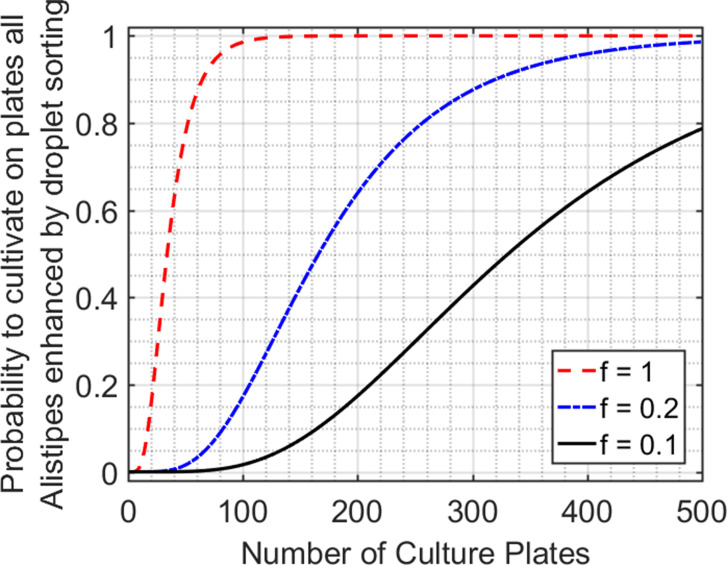
The droplet technology enables high-throughput isolation and cultivation of organisms in discrete picoliter volumes with millions of individual drops per mL of droplet emulsion. In contrast, the conventional method of low-dilution plating achieves pure strain isolation by spreading the inoculum at low enough density on agar plates so that growing colonies do not overlap. In this Supplementary Figure, we calculate the equivalent number of culture plates needed to isolate and cultivate the 6 Alistipes populations enhanced by droplet sorting. For low-dilution plating aimed at isolating slow-growing organisms, we assume a plating density of 1 cell/cm2 on a standard 100 mm circular culture plate = 78 cells/plate. The probability for a given population, X1, to be present and grow follows from binomial random sampling and is P(X1 > 0) = 1 – P(X1 = 0) = 1 – (1 – f*p1)n, where n is the number of colonies, p1 is the abundance of X1 in the initial inoculum, and f is a constant which describes the fraction of X1 which will grow in the environmental conditions. If the number of colonies is much greater than the number of populations we are aiming to grow, then P(Isolate and cultivate all populations of interest) = P(X1 > 0) * P(X2 > 0) *. . .* P(Xm > 0), where m is the number of unique populations. The figure above plots P(Isolate and cultivate the 6 droplet sorting enhanced Alistipes populations) for varying f. Even in the most optimistic scenario, where every Alistipes cell is guaranteed to grow on the low-dilution culture plate, it would still require 65 culture plates to have a 90% chance at isolating and growing all 6 populations.


