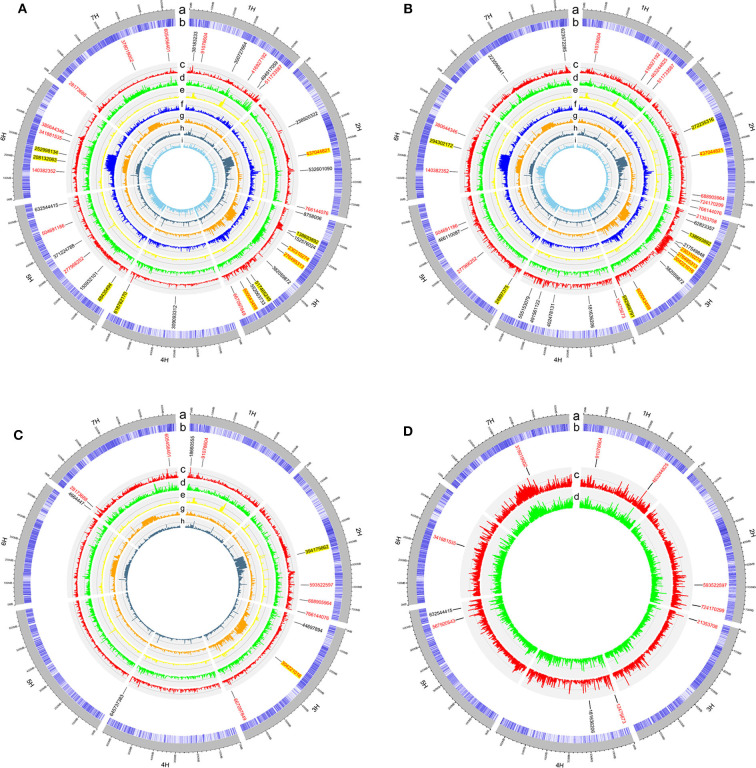
Figure 3.
The circular plots for heading date in Lhasa (HD_LS) (A), plant height in Namling (PH_NM) (B), spike length in Nyingchi (SL_NC) (C), and spike length in Namling (SL_NM) (D). From the outer circle to the inner circle, a is for the barley genome; b is for the SNP density; c is for the manhattan plot from generalized linear model (GLM); d is for the manhattan plot from mixed linear model (MLM); e is for the manhattan plot from EigenGWAS under the tenth eigenvector (EV10); f is for the manhattan plot from EigenGWAS under the seventh eigenvector (EV7); g is for the manhattan plot from EigenGWAS under the fifth eigenvector (EV5); h is for the manhattan plot from EigenGWAS under the third eigenvector (EV3); and i is for the manhattan plot from EigenGWAS under the second eigenvector (EV2). The SNP positions associated with the trait of interest were marked in black font; of which with pleotropic effects were highlighted in red font; and detected by EigenGWAS were highlighted in yellow background.

