Figure 1.
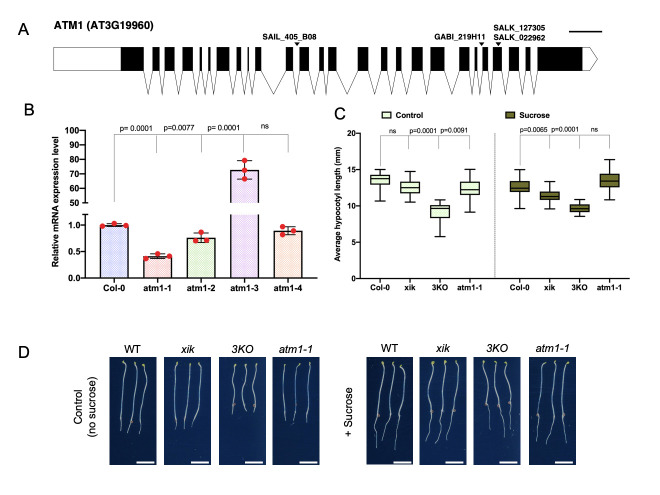
(A) Schematic gene structure of ATM1 (AT3G19960) indicating the T-DNA insertions assayed in this study: SAIL_405_B08 (atm1-1), SALK_127305 (atm1-2), GABI_209H11 (atm1-3), and SALK_022962 (atm1-4). Black boxes and lines depict exons and introns respectively. Scale bar is 100 bases. (B) ATM1 transcript levels in different alleles (atm1-1, atm1-2, atm1-3, and atm1-4) compared to Columbia Ecotype (Col-0) assayed by quantitative PCR (qPCR). (C) Average hypocotyl length of seedlings grown on 0.5X Murashige and Skoog (MS) medium with or without 15 mM sucrose in the dark for 5 days. A total of 30-40 seedlings were evaluated and the assay was replicated three times (panel shows the results from one experiment). Error bars show standard error. P values are calculated using one- or two-way ANOVA followed by Tukey multiple comparisons; ns: not significant. (D) Hypocotyl phenotypes after 5 days of incubation in continuous darkness. Scale bar: 5mm

