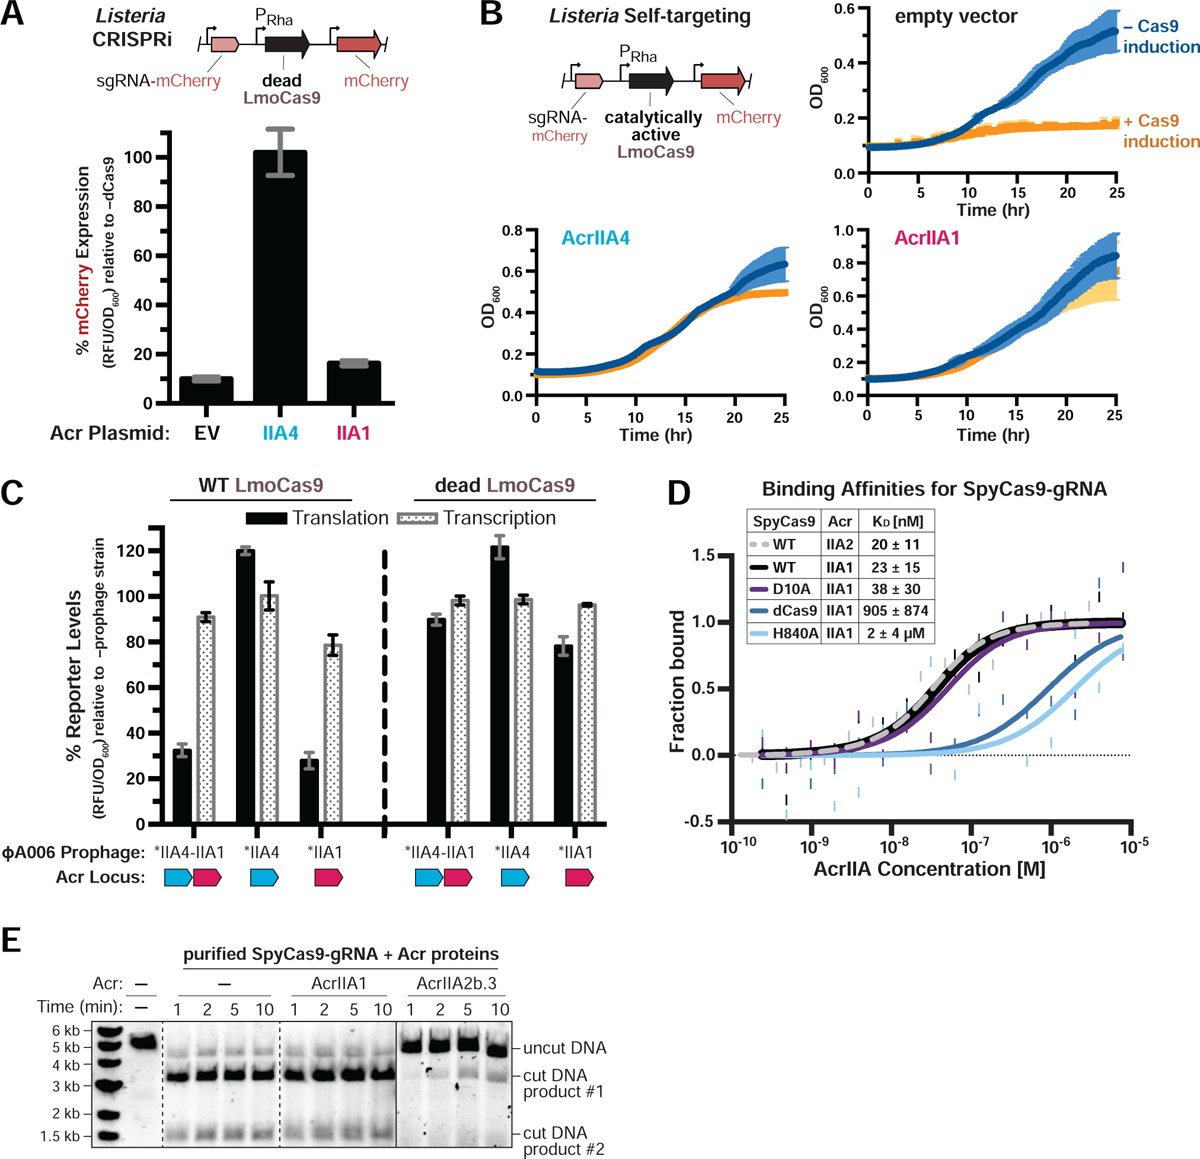
Figure 2. AcrIIA1 Selectively Binds Catalytically Active Cas9 to Trigger its Degradation.

(A-B) Acr-mediated inhibition of CRISPRi (A) or self-targeting (B). Lmo10403s contains chromosomally-integrated constructs expressing dead (A) or catalytically active (B) LmoCas9 from the inducible pRha-promoter and sgRNA that targets the pHelp-promoter driving mCherry expression. For CRISPRi, mCherry expression measurements reflect the mean percentage fluorescence (RFU/OD600) in deadCas9-induced cells relative to uninduced controls (−dCas9) of three biological replicates ± SD (error bars) (A). For self-targeting, bacterial growth was monitored after LmoCas9 induction (orange lines) or no induction (blue lines) and data are displayed as the mean OD600 of three biological replicates ± SD (error bars) (B). See Figure S2A for CRISPRi data with Lmo10403s expressing deadSpyCas9. (C) Translational (black bars) and transcriptional (gray shaded bars) reporter levels of catalytically active (left) and dead LmoCas9 (right) in Lmo10403s lysogenized with engineered isogenic ΦA006 prophages. Cas9 reporter measurements reflect the mean percentage mCherry relative fluorescence units (RFU/OD600) in the indicated lysogens relative to the control strain lacking a prophage (−prophage). Error bars represent the mean ± SD of at least three biological replicates. Asterisk (*) denotes genes containing the native orfA RBS (strong) in ΦA006 and unmarked genes contain their native RBS. See Figure S2B for equivalent data with Lmo10403s expressing SpyCas9. (D) Quantification of the binding affinities (KD; boxed inset) of Acr proteins for WT, catalytically dead (dCas9), or nickase (D10A or H840A) SpyCas9-gRNA complexes using microscale thermophoresis. Data shown are representative of three independent experiments. See Figure S2D for additional controls with AcrIIA2b.3 (IIA2, dashed line). (E) Time course of SpyCas9 DNA cleavage reactions in the presence of Acr proteins that were recombinantly purified from E. coli. Dashed lines indicate where intervening lanes were removed for clarity. Solid lines indicate a separate image. Data shown are representative of three independent experiments.
