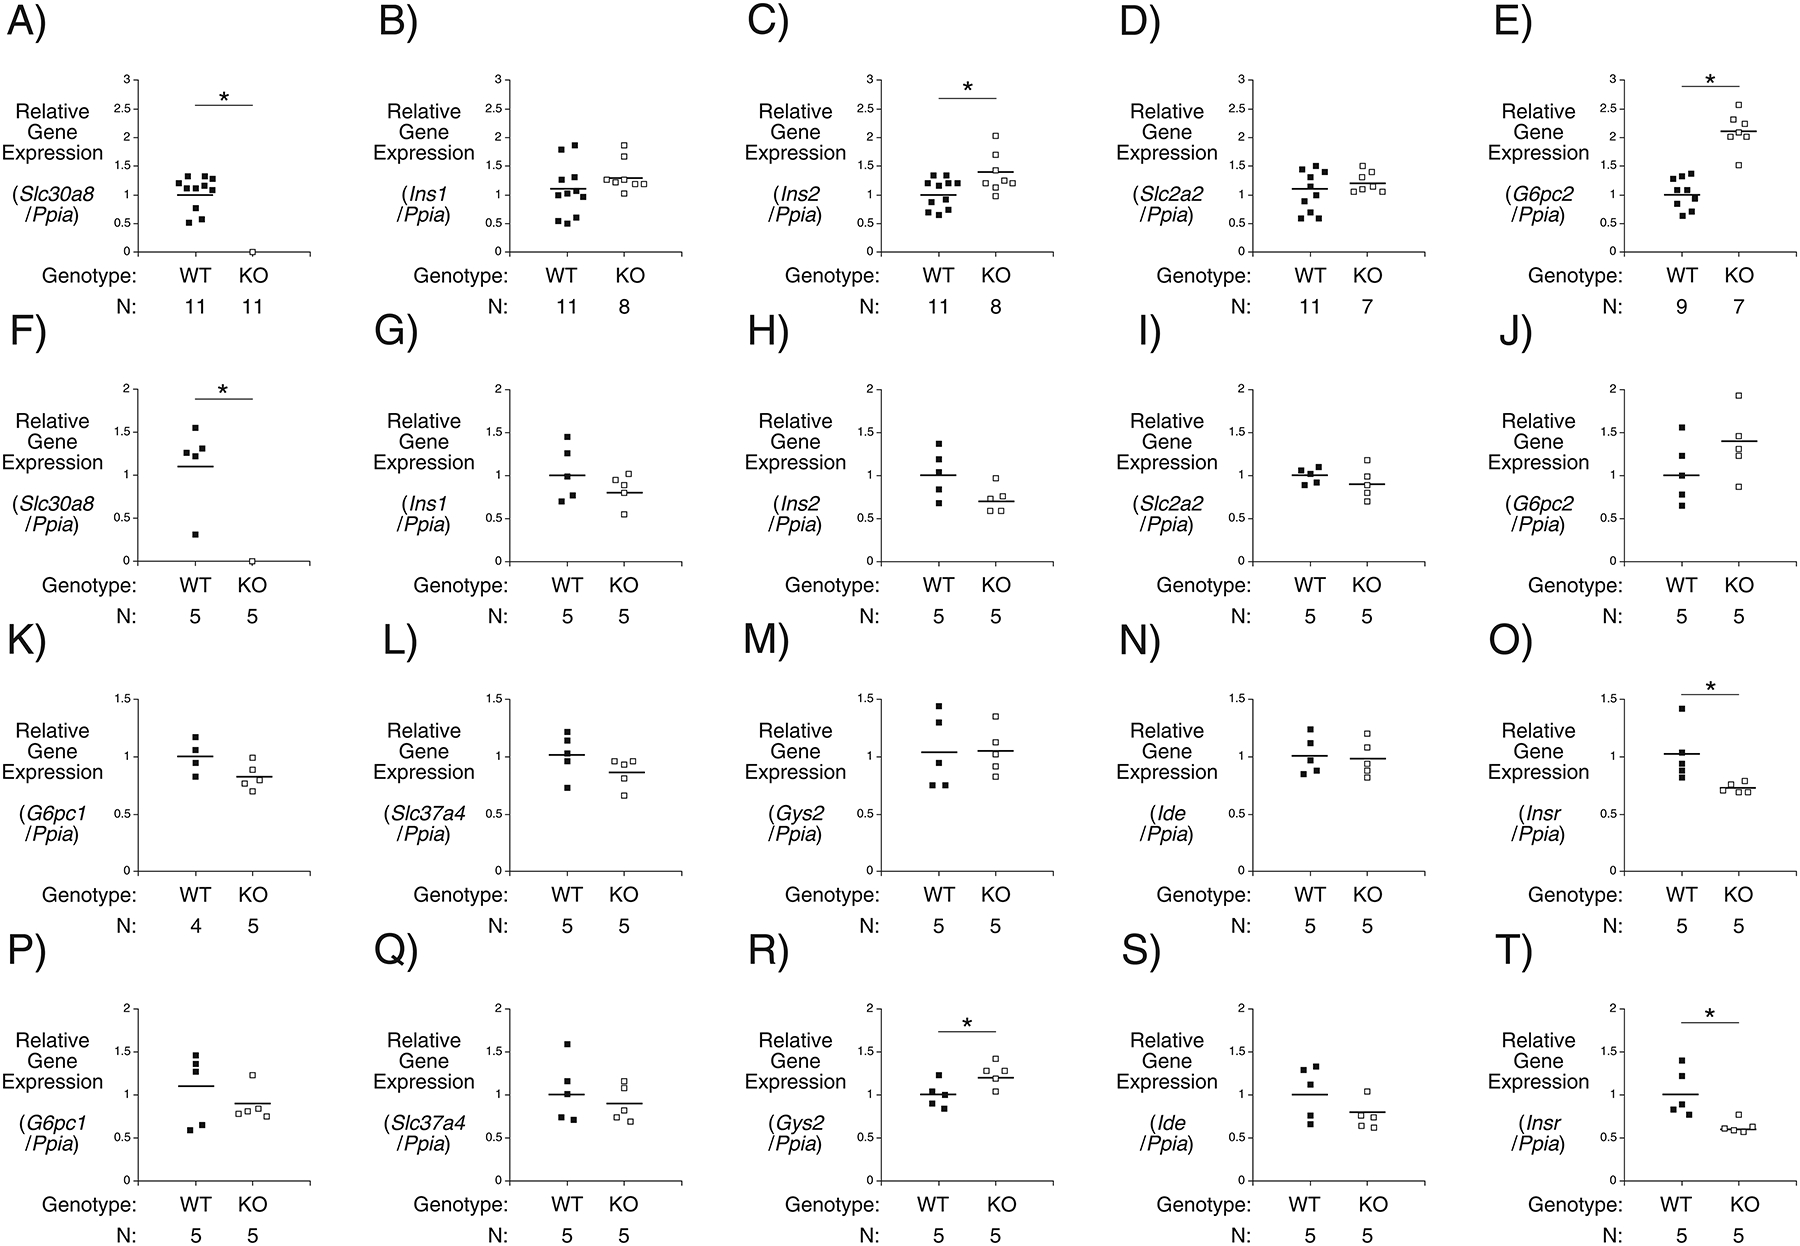
Figure 5. Comparison of Pancreatic and Hepatic Gene Expression in 4 Week and 10 Week Old C57BL/6J Wild Type and Slc30a8 KO Male Mice.

Comparison of pancreatic Slc30a8 (Panels A and F), Ins1 (Panels B and G), Ins2 (Panels C and H), Slc2a2 (Panels D and I), G6pc2 (Panels E and J) and hepatic G6pc1 (Panels K and P), Slc37a4 (Panels L and Q), Gys2 (Panels M and R), Ide (Panels N and S) and Insr (Panels O and T) gene expression in 6 hour fasted 4 week and 10 week old male mice, respectively. Gene expression was quantitated relative to Ppia (cyclophilin A) expression in the indicated tissue. Results show the mean data ± S.E.M. with the genotype and number of animals indicated. *, differences between WT and KO; p < 0.05, Student’s t-test.
