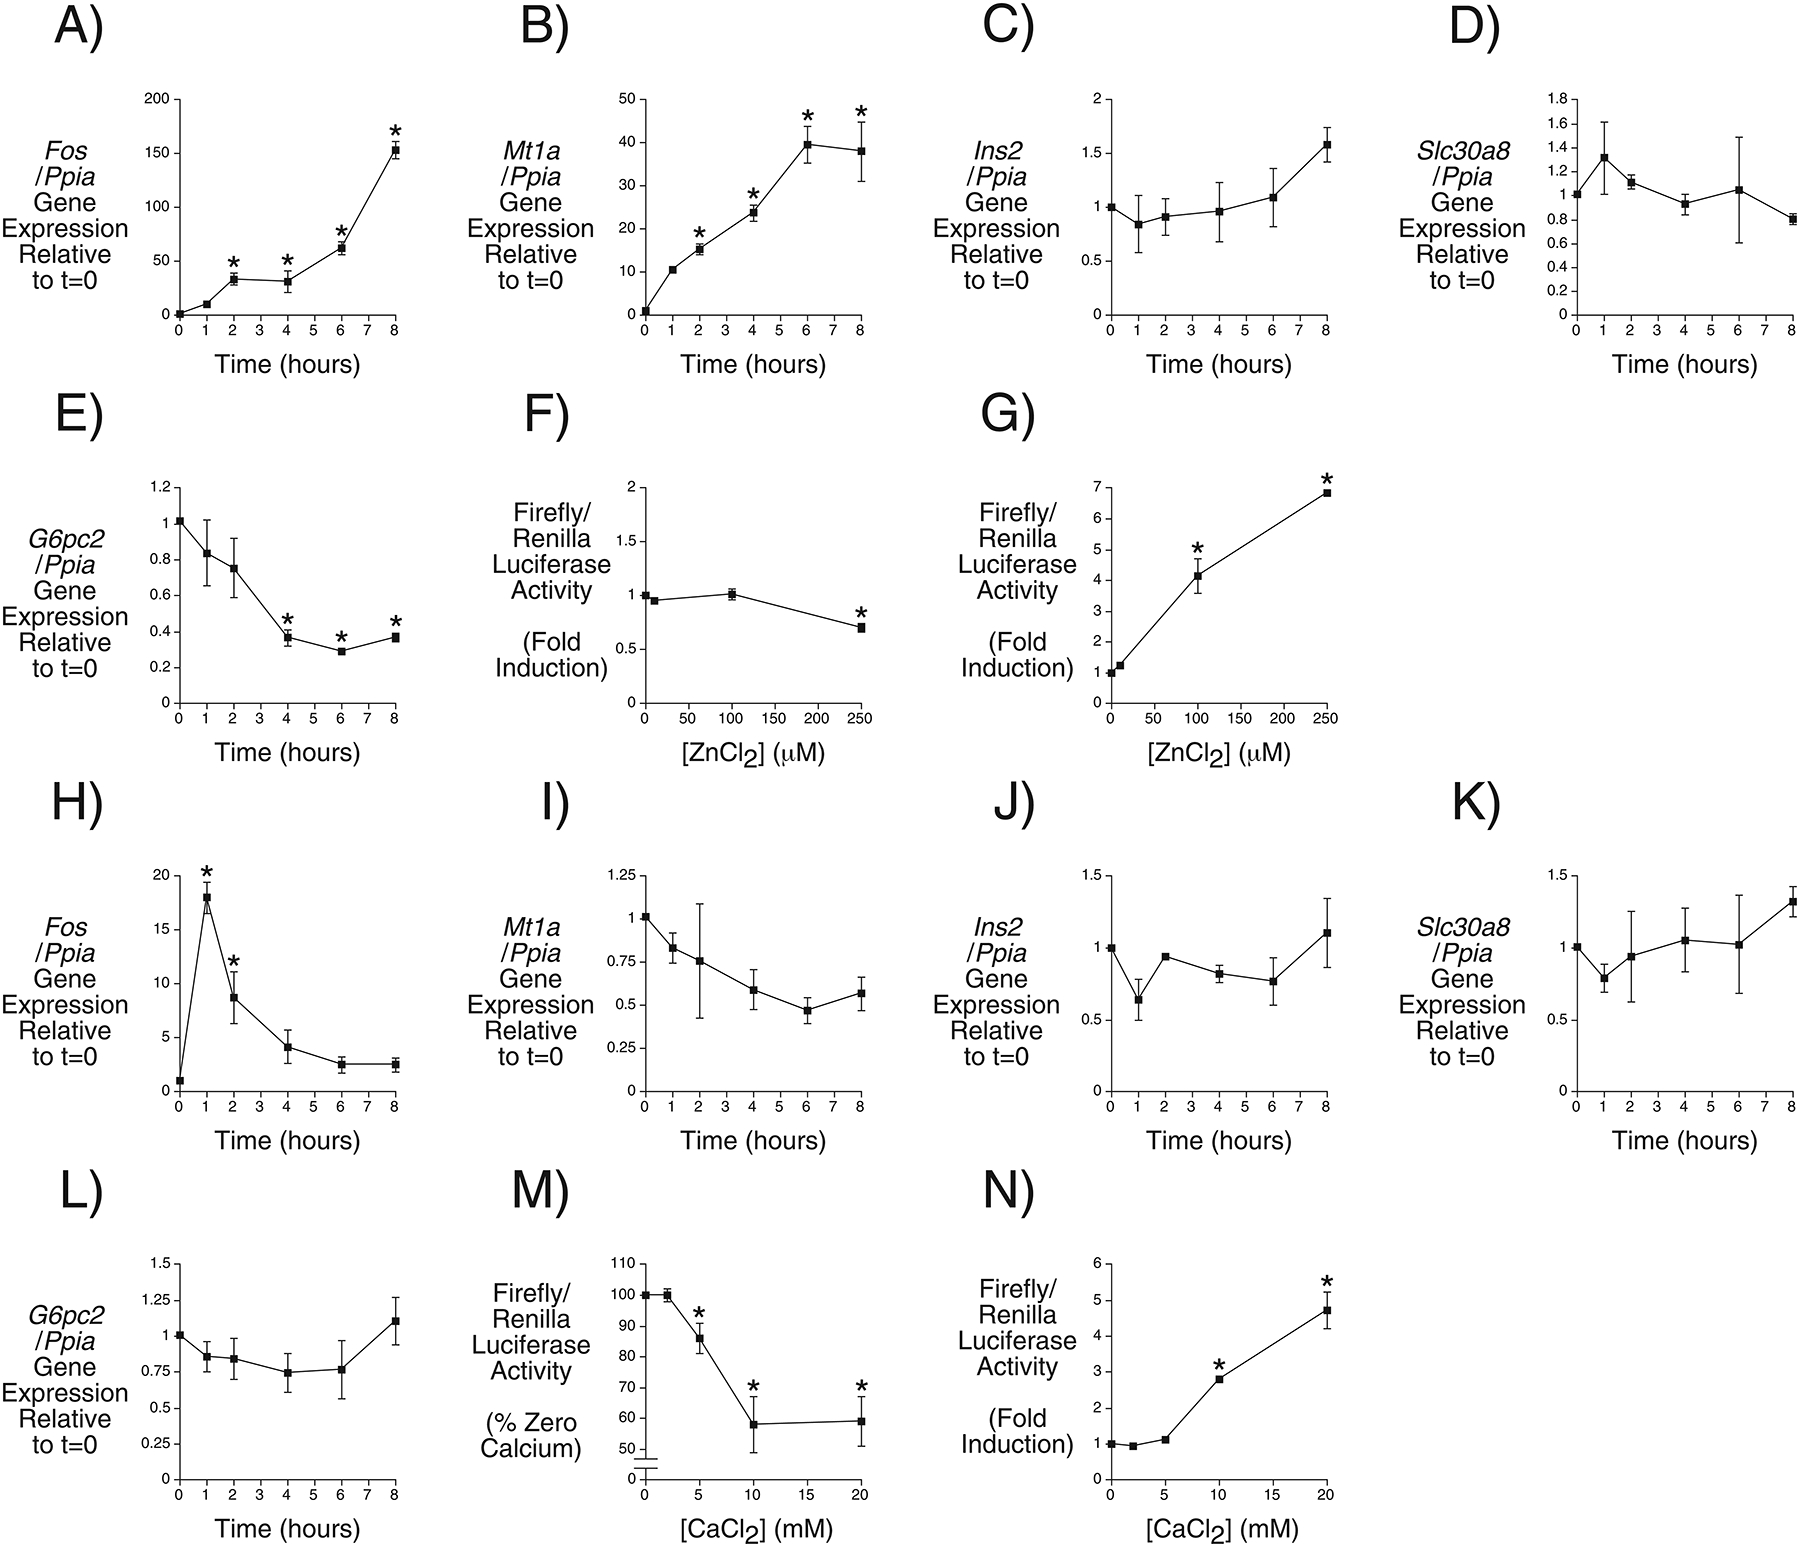
Figure 6. Comparison of Zinc- and Calcium-Regulated Endogenous and Fusion Gene Expression in the βTC-3 Cell Line.

Regulation of endogenous Fos (Panels A and H), Mt1a (Panels B and I), Ins2 (Panels C and J), Slc30a8 (Panels D and K) and G6pc2 (Panels E and L) gene expression over time by 250 μM zinc chloride and 20 mM calcium chloride, respectively. Gene expression was quantitated relative to Ppia (cyclophilin A) expression. Results represent the mean data ± S.E.M. derived from 3–4 independent experiments. *, differences with t=0; p < 0.05, one-way ANOVA. Regulation of mouse G6pc2-luciferase (Panel F) and metal response element-albumin-luciferase (Panel G) fusion gene expression by the indicated concentration of zinc chloride. Regulation of mouse G6pc2-luciferase (Panel M) and cAMP response element-albumin-luciferase (Panel N) fusion gene expression by the indicated concentration of calcium chloride. Results represent the mean data ± S.E.M. derived from 3 independent experiments. *, differences with no zinc or calcium chloride; p < 0.05, one-way ANOVA.
