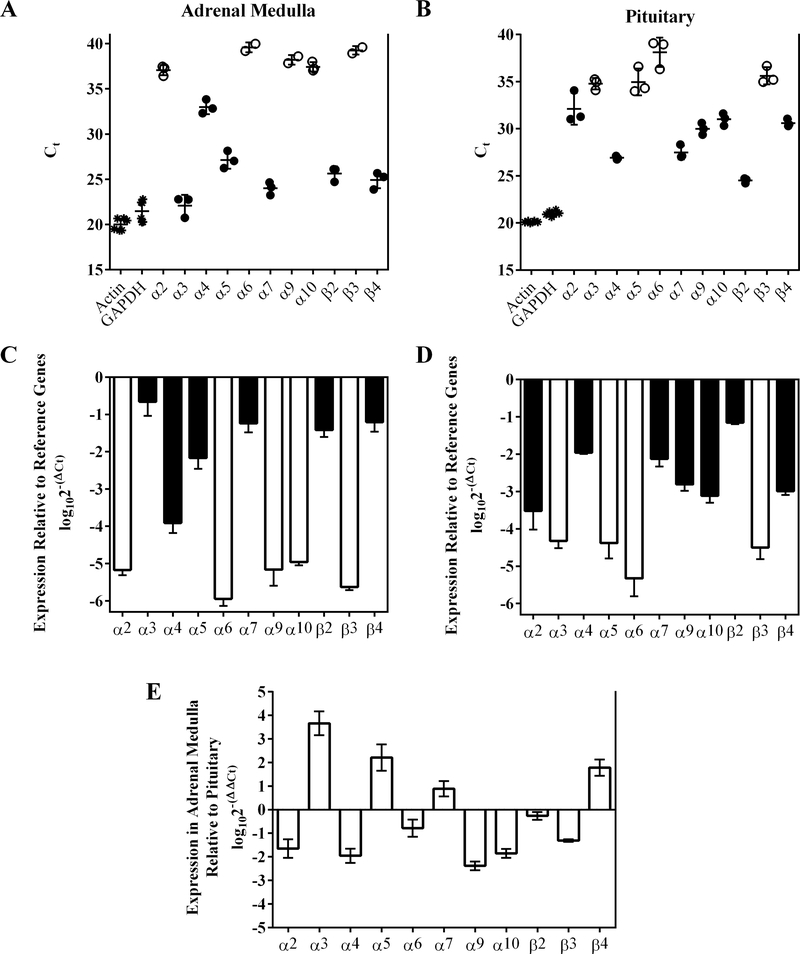
Figure 1.
qPCR of rat adrenal medulla and pituitary gland reveals the expression of mRNAs for multiple nAChR subunits. Isolated mRNA from three rat adrenal medulla and three pituitary glands from the same animals were analyzed by qPCR as described in Methods. Panel (A) shows the Ct values for the mRNAs assayed in adrenal medulla. Each data point represents the average of three technical repeats for each gene from a single animal except for α6, α9, and β3 subunit. For α6 and β3 subunits, mRNA was only detected in two of three animals and signal was not detected in every technical repeat. For α9 subunits, signal reached threshold for two of three animals. Panel B shows the Ct values for the mRNAs present in pituitary. Each data point represents the average of three technical repeats for each gene from a single animal. Closed circles in A and B indicate average Ct values ≤35 whereas open circles indicate values >35. Panels C and D show the expression levels of nAChR subunit mRNAs relative to those of the reference genes actin and GAPDH; panel C is for adrenal medulla and D is for pituitary. (E) A pairwise comparison for each nAChR subunit gene of the relative expression levels present in adrenal medulla and pituitary. Positive values indicate higher levels of expression in the adrenal medulla and negative values indicate higher levels in the pituitary for each gene. The error bars in all graphs denote the SD; values and statistical comparisons are provided in Table 1.

