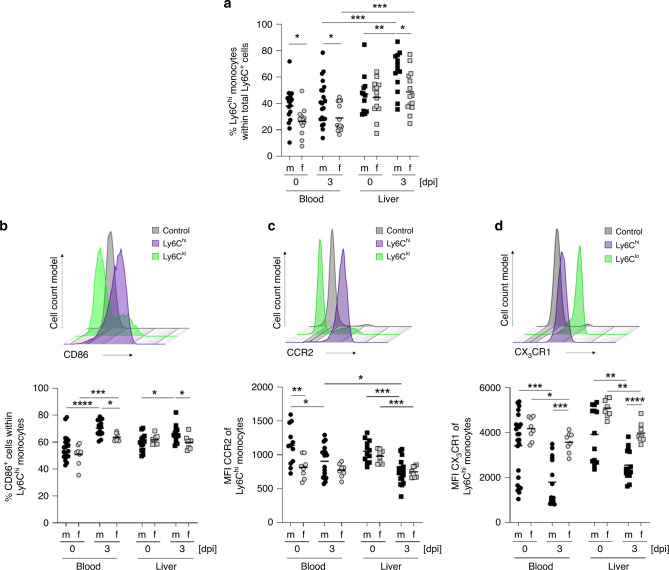
Fig. 2. Male mice show higher percentages of classical monocytes upon infection.
a Percentage of Ly6Chi monocytes within the total Ly6C+ monocyte population of CD11b+ cells isolated from the blood and liver of naïve and E. histolytica (Day 3 p.i.)-infected mice (blood: nm/f d0 = 16/13; nm/f d3 = 21/14; liver: nm/f d0 = 12/13; nm/f d3 = 13/14; pooled data of four independent experiments; depicted are the means). Histogram and percentage of b CD86+ cells, and the c MFI of CCR2 and d CX3CR1 of Ly6Chi monocytes in the blood and the liver of naïve and E. histolytica-infected mice (Day 3 p.i.), as determined by flow cytometry (b blood: nm/f d0 = 19/8; nm/f d3 = 15/8; liver: nm/f d0 = 13/8; nm/f d3 = 15/8; c blood: nm/f d0 = 12/8; nm/f d3 = 17/8; liver: nm/f d0 = 12/8; nm/f d3 = 17/8; d blood: nm/f d0 = 24/8; nm/f d3 = 15/8; liver: nm/f d0 = 13/8; nm/f d3 = 15/8; pooled data of two independent experiments; depicted are the means). P-values were calculated using two-tailed grouped analysis Mann–Whitney test (a–d), *P < 0.05; **P < 0.01; ***P < 0.001; ****P < 0.0001). Source data are provided as a Source Data file.

