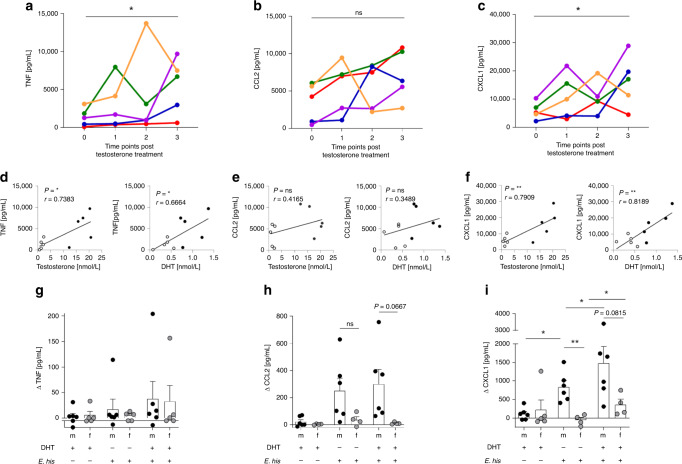
Fig. 6. Androgens modulates secretion of TNF and CXCL1 by PBMCs from transgender men.
Cytokine production by LPS-stimulated PBMCs isolated from five women transitioning to men under testosterone treatment. Women received testosterone intramuscularly, and PBMCs were collected at different time points from the start of hormone treatment (0 (Days −9–0); 1 (Days 39–42); 2 (Days 112–126); and 3 (Days 201–219)) and stimulated with LPS (0.1 µg/mL) for 17 h. Concentrations of a TNF, b CCL2, and c CXCL1 in the supernatant were measured using a Multiplex Cytokine Assay or ELISA (CCL2). Each donor is depicted in an individual color (a n0,1,2,3 = 5; b n0,1,2,3 = 5; c n0,1,2,3 = 5). Correlation between testosterone and 5α-dihydrotestosterone (DHT) plasma levels in transgender men with d TNF, e CCL2, and f CXCL1 before transformation and at time point three post-transformation. Treatment of isolated peripheral, MACS-purified monocytes from healthy men and women with E. histolytica lysate (0.1 mg/mL) either alone or in the presence of DHT (10 nM) for 24 h. g TNF, h CCL2, and i CXCL1 concentrations in the supernatant were determined using a Multiplex Cytokine Assay or ELISA (CCL2) (g nm/f DHT+/Ehis− = 6/5; nm/f DHT−/Ehis+ = 6/5; nm/f DHT+/Ehis+ = 6/5; h nm/f DHT+/Ehis− = 6/4; nm/f DHT−/Ehis+ = 6/4; nm/f DHT+/Ehis+ = 6/4; i nm/f DHT+/Ehis− = 6/5; nm/f DHT−/Ehis+ = 6/5; nm/f DHT+/Ehis+ = 6/5; pooled data from three independent experiments; Depicted are the means ± SEM; to normalize the baseline of the donors, values for unstimulated controls were subtracted from stimulated samples). a–c P-values were calculated using two-tailed paired analysis Student’s t test (*P < 0.05) or d–f two-tailed Pearson correlation coefficient (r; *P < 0.05, **P < 0.01) with a simple linear regression. For g–i a two-tailed paired analysis was performed for each donor for each stimulation set up and two-tailed grouped analysis for the comparison between men and women: Student’s t-test, *P < 0.05, **P < 0.01. Source data are provided as a Source Data file.

