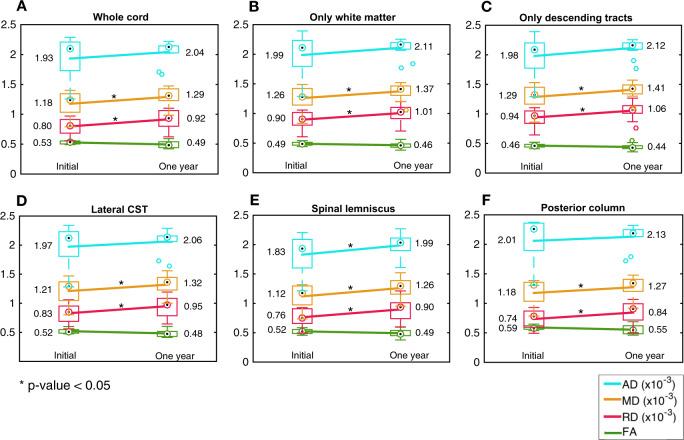
Fig. 7. Longitudinal changes in diffusion metrics.
Longitudinal changes in ALS participants (n = 11), in FA, RD, MD, and AD (averaged across C2–C6) in (a) whole spinal cord, (b) spinal white matter, (c) descending tracts, (d) lateral CST, (e) spinal lemniscus, and (f) posterior columns. The line between initial and one year data connects the means (the numerical values in the text). The box plots show the median (circle with dot), 25th and 75th percentiles (edges of the box), and the range of FA/CSA (the whisker end points) excluding the outliers (individual circles).

