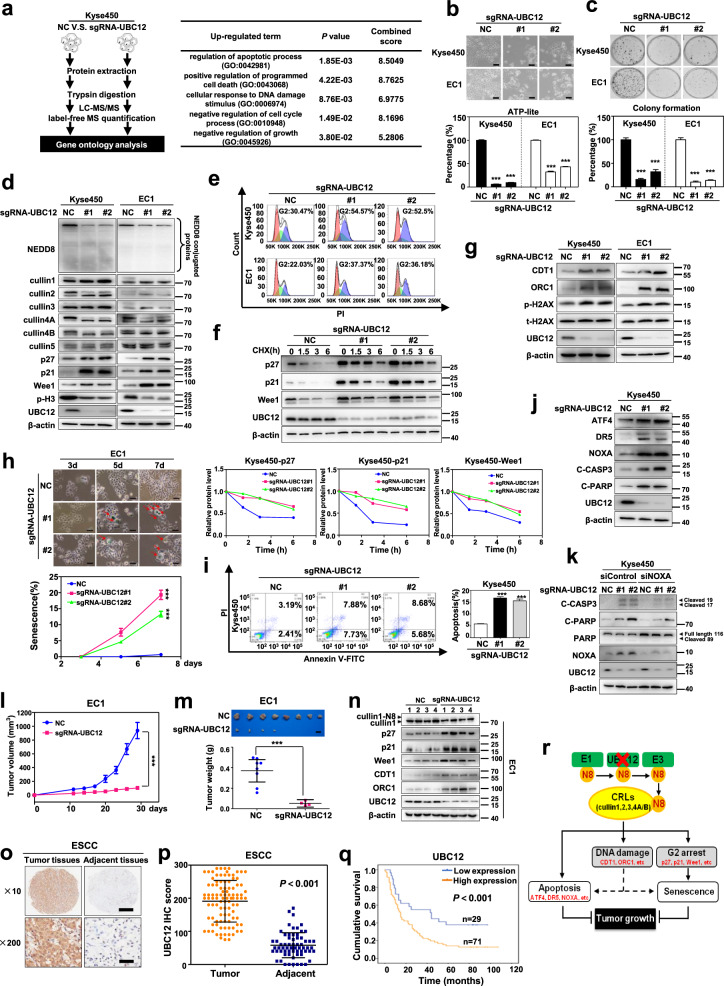
Fig. 1.
Validation of UBC12 as a new anticancer target in ESCC. a GO analysis based on quantitative proteomics strategy was used to reveal the changed cellular responses upon UBC12 knockdown. b UBC12-knockdown Kyse450 and EC1 stable cells with two different sgRNA-UBC12 oligos were generated by CRISPR/Cas9 system, and subjected to the micrograph and cell proliferation analysis using ATPlite assay. Scale bar = 200 μm. c The colony forming ability of UBC12-knockdown ESCC cells was determined by cell colony formation assay. d Immunoblotting was used to analyze the neddylation levels of global protein, cullin 1, 2, 3, 4A, 4B, and 5, as well as p27, p21, Wee1 and p-H3 upon UBC12 knockdown with β-actin as a loading control. e PI staining and FACS analysis were used to analyze the cell cycle profile upon UBC12 knockdown. f CHX was used to block protein synthesis, and protein lysates were extracted and subjected to immunoblotting against p27, p21, and Wee1 with β-actin as a loading control. g Immunoblotting analysis was used to assess the expression levels of CDT1, ORC1 and phosphorylated/total H2AX upon UBC12 knockdown with β-actin as a loading control. h Senescent EC1 cells with positive β-Galactosidase staining were pointed out with arrows. Scale bar = 50 μm. Statistical analysis showed that UBC12 knockdown time-dependently induced EC1 cell senescence. i UBC12 knockdown induced apoptosis of Kyse450 cells determined by AnnexinV-FITC/ PI double-staining analysis. j Immunoblotting analysis was used to assess the expression levels of apoptotic related proteins ATF4, DR5, NOXA, cleaved PARP and cleaved caspase3 upon UBC12 knockdown in Kyse450 cells. k Stable cells were transfected with either siControl or siNOXA for 72 h, and then subjected to immunoblotting analysis for cleaved caspase3, cleaved PARP, PARP and NOXA with β-actin as a loading control. l Tumor size was determined by caliper measurement, and the data were converted to tumor growth curve. m Mice were sacrificed and tumor tissues were harvested and photographed. Scale bar = 1 cm. The tumor weight was obtained on the sacrificed day. n Proteins extracted from tumor tissues and subjected to immunoblotting analysis against cullin 1, p27, p21, Wee1, CDT1, ORC1 and UBC12 with β-actin as a loading control. o IHC staining of human ESCC tissue arrays using specific antibody for UBC12. Scale bar for ×10 images, 500 μm; Scale bar for ×200 images, 25 μm. p The expression difference of UBC12 in the ESCC tissues of patients and adjacent normal tissues by histological evaluation. q Kaplan–Meier curves for overall survival rate of patients with ESCC based on UBC12 expression. r Shown was the schema of the mechanism for UBC12 knockdown suppressing tumor growth in ESCC. Representative images were shown. Shown were average values with standard deviation. *** denotes the P < 0.001.

